
On 4 September 2017, the Duke and Duchess of Cambridge – better known as “William and Kate” – announced they were expecting their third child. Bookmakers immediately began taking bets. At the time of writing, most were offering 10/11 on a boy and 10/11 on a girl (i.e., those who bet £11 would win £10). They were also taking bets on the choice of name: Mary was the bookies’ favourite for a girl, with odds of 3/1, while Arthur was the favourite for a boy, at 9/1.
In October, the public were given a month-wide ‘due date’ of April 2018 but, interestingly, none of the online bookmakers we checked are taking bets on the actual date of the royal birth. However, punters can bet on the timing of the birth, with bookies offering 11/2 for each of the seven days of the week, 9/2 for each of six four-hour time-slots, and 33/1 for each of the 7 x 6 = 42 day-specific time-slots.
At first, one might wonder whether such uniform odds are wise. In the general population, obstetric interventions have concentrated births during the week, reduced the numbers of weekend births and dramatically altered the pattern within each day.1,2 These patterns are driven in part by repeat caesarian deliveries, and by the staffing schedules at birthing centres. However, these forces are less applicable to the royal birth, and so it is perhaps understandable that the odds being offered by the bookmakers in relation to timing are uniform. Likewise, that the first two royal births took place on a Monday and a Saturday respectively is hardly a reason to substantially shorten or lengthen any of the odds.
But back in 2013, when William and Kate were expecting their first child, the Royal Mint may have been interested to know the likely day of birth – to help them work out how many other babies might be born the same day. As reported by the Times, the Mint was to give away 2,013 commemorative silver pennies to those who shared the royal birthdate. Would that be enough to ensure all babies born that day received one? The newspaper thought it might, “with luck”, noting that “an average of 1,983 babies are born in England and Wales each day”.
Just how much luck was needed? And would a popular ‘off the shelf’ statistical distribution have helped the Mint with its probability calculations? In what follows, we revisit the data available to 2013 planners and measure how they fared. We also offer a giveaway of our own to the reader who comes closest to forecasting the actual number of births in England and Wales on whatever day the new prince or princess is born.
How much luck? The 2013 giveaway
If the Royal Mint’s 2013 offer were limited to parents in England and Wales, and all eligible parents claimed their child’s penny, how likely was it that 2,013 silver pennies would be enough?
One might take a minimalist approach to this problem, using only the same latest official information that the Times reporter had – namely, that there were 723,913 live births in England and Wales in 2011, two years earlier. It was this total that allowed him to calculate a mean of 723,913 ÷ 365 = 1,983 births per day.
In the absence of any information on the actual fluctuations around this mean, advisors to the Mint might be tempted to use the fluctuations shown in the top panel of Figure 1. They are derived from a Poisson distribution, a distribution often used with randomly varying counts, and the only such one that can be derived from just knowing about its mean. The formula gives a probability for every possible number of births, but for presentation reasons, the lengths of the vertical bars represent probabilities for bins of width 10.

FIGURE 1 Probability (shown in green) that the total of 2,013 coins minted to commemorate the 2013 royal birth would allow the Royal Mint to give one to each baby born that day. Calculations are based on the numbers of births in England and Wales in 2011, the last year for which figures were available at the time. The calculations in the top panel are based on a single Poisson distribution with mean 1,983, while those in the middle one are based on day-of-week-specific Poisson distributions with differing means. The single distribution on the bottom panel, with the same mean of 1,983, is a mix of the seven distributions.
By summing the individual probabilities, the advisors could calculate the probability that the 2,013 silver pennies would be enough. As one can see from the portion of the distribution coloured green, the probability is approximately 75%.
Planners would not need to use the exact Poisson probabilities to calculate this, since the distribution is quite well approximated by a normal (Gaussian) distribution with mean 1,983 and standard deviation √1,983 ≈ 45. Thus, one can calculate that approximately 2,060, 2,090, or 2,150 pennies would ensure 95%, 99% or 99.99% probabilities respectively. These limits are relatively tight because the standard deviation is only (just over) 2% of the mean.
In some very specialised contexts, a single Poisson distribution can adequately describe the variation of counts. However, when human and environmental influences play a role, a single Poisson distribution is typically too tight. Examples where the variation is considerably wider include daily numbers of road accidents, new cancer diagnoses, deaths… and births.1 Thus, the advisors should not have been 75% confident that even as many as 2,150 pennies would be enough to avoid any disappointed parents.
Numbers of daily births do vary slightly over the year. But nowadays the largest variations are ‘statistically induced’ by obstetrical interventions that produce a marked day of the week pattern. From subtotals kindly provided by the authors of a March 2017 article, the day-of-week means in England and Wales in the year 2011, rounded to the nearest 10, were:
| Monday | Tuesday | Wednesday | Thursday | Friday | Saturday | Sunday |
| 2,000 | 2,080 | 2,080 | 2,120 | 2,090 | 1,800 | 1,720 |
These averages, shown as the seven black dots in the middle panel in Figure 1, varied approximately 1.25-fold, with the greatest and least numbers on Thursdays and Sundays respectively.
The variations are driven in part by elective inductions and cesareans, which are usually limited to weekdays. Birth rates are higher on Saturdays than Sundays because of inductions begun on Fridays, and lower on Mondays than other weekdays because fewer inductions are begun on Sunday.
Thus, it would be safer to use the seven day-of-week-specific means, with a separate Poisson probability model for the variation around each mean. Under this planning model, if rates and patterns in 2011 were to persist into 2013, then the Mint might be stuck with as many as 350 extra pennies if the birth were to occur on a Sunday, or face a deficit as large as 250 if it were to occur on a Thursday.
The probability of having enough coins is 75% if calculated using an “average” day. It is close to 60% on Monday (the nearest there is to an “average” day), whereas it is under 10% for the other four weekdays and virtually 100% for the two weekend days. The mean of the seven probabilities is close to 40% and their median is close to 10% (see bottom panel of Figure 1).
The first royal birthday occurred on 22 July, a Monday. The overall mean number of live births per day in England and Wales in 2013 was 1,914 – down by a considerable 80 per day (4.3%) from the previous two years. The mean for Mondays is the only one of the seven that is close to that average, but, as luck would have it, the 2,053 births that particular Monday was substantially higher than the Monday average. However, according to the Telegraph, only 1,765 silver pennies were claimed, thereby saving the Royal Mint from possible statistical embarrassment.
Incidentally, contrary to the impressions given by the various media reports of the giveaway, the Mint was not left holding 248 unclaimed pennies. It sold them! Each year, the Mint offers a year-dated Baby’s Silver Penny that (at £30) “makes the perfect present by itself, or can be bought alongside other baby and christening gifts”.
The 2018 giveaway
Even though the date itself will have to be treated as an unknown, enterprising readers may still wish to forecast how many births there will be in England and Wales on the same day as the next royal birth. They will face two substantial statistical challenges. One is deciding which of the values in a distribution like the one in the bottom panel of Figure 1 would be best to bet on. The other is anticipating how far the 2018 distribution will have moved up or down since the last year (2016) for which we have data. The numbers of births averaged 1,912 per day in 2015 and 1,902 in 2016. As one can see in Figure 2, the one-year drop of 4.3% in 2013 was the largest in almost 40 years, presumably brought about by the economic shock of 2012. This time around, the uncertainty concerning Brexit may affect the overall number, and thus the numbers of shared births.
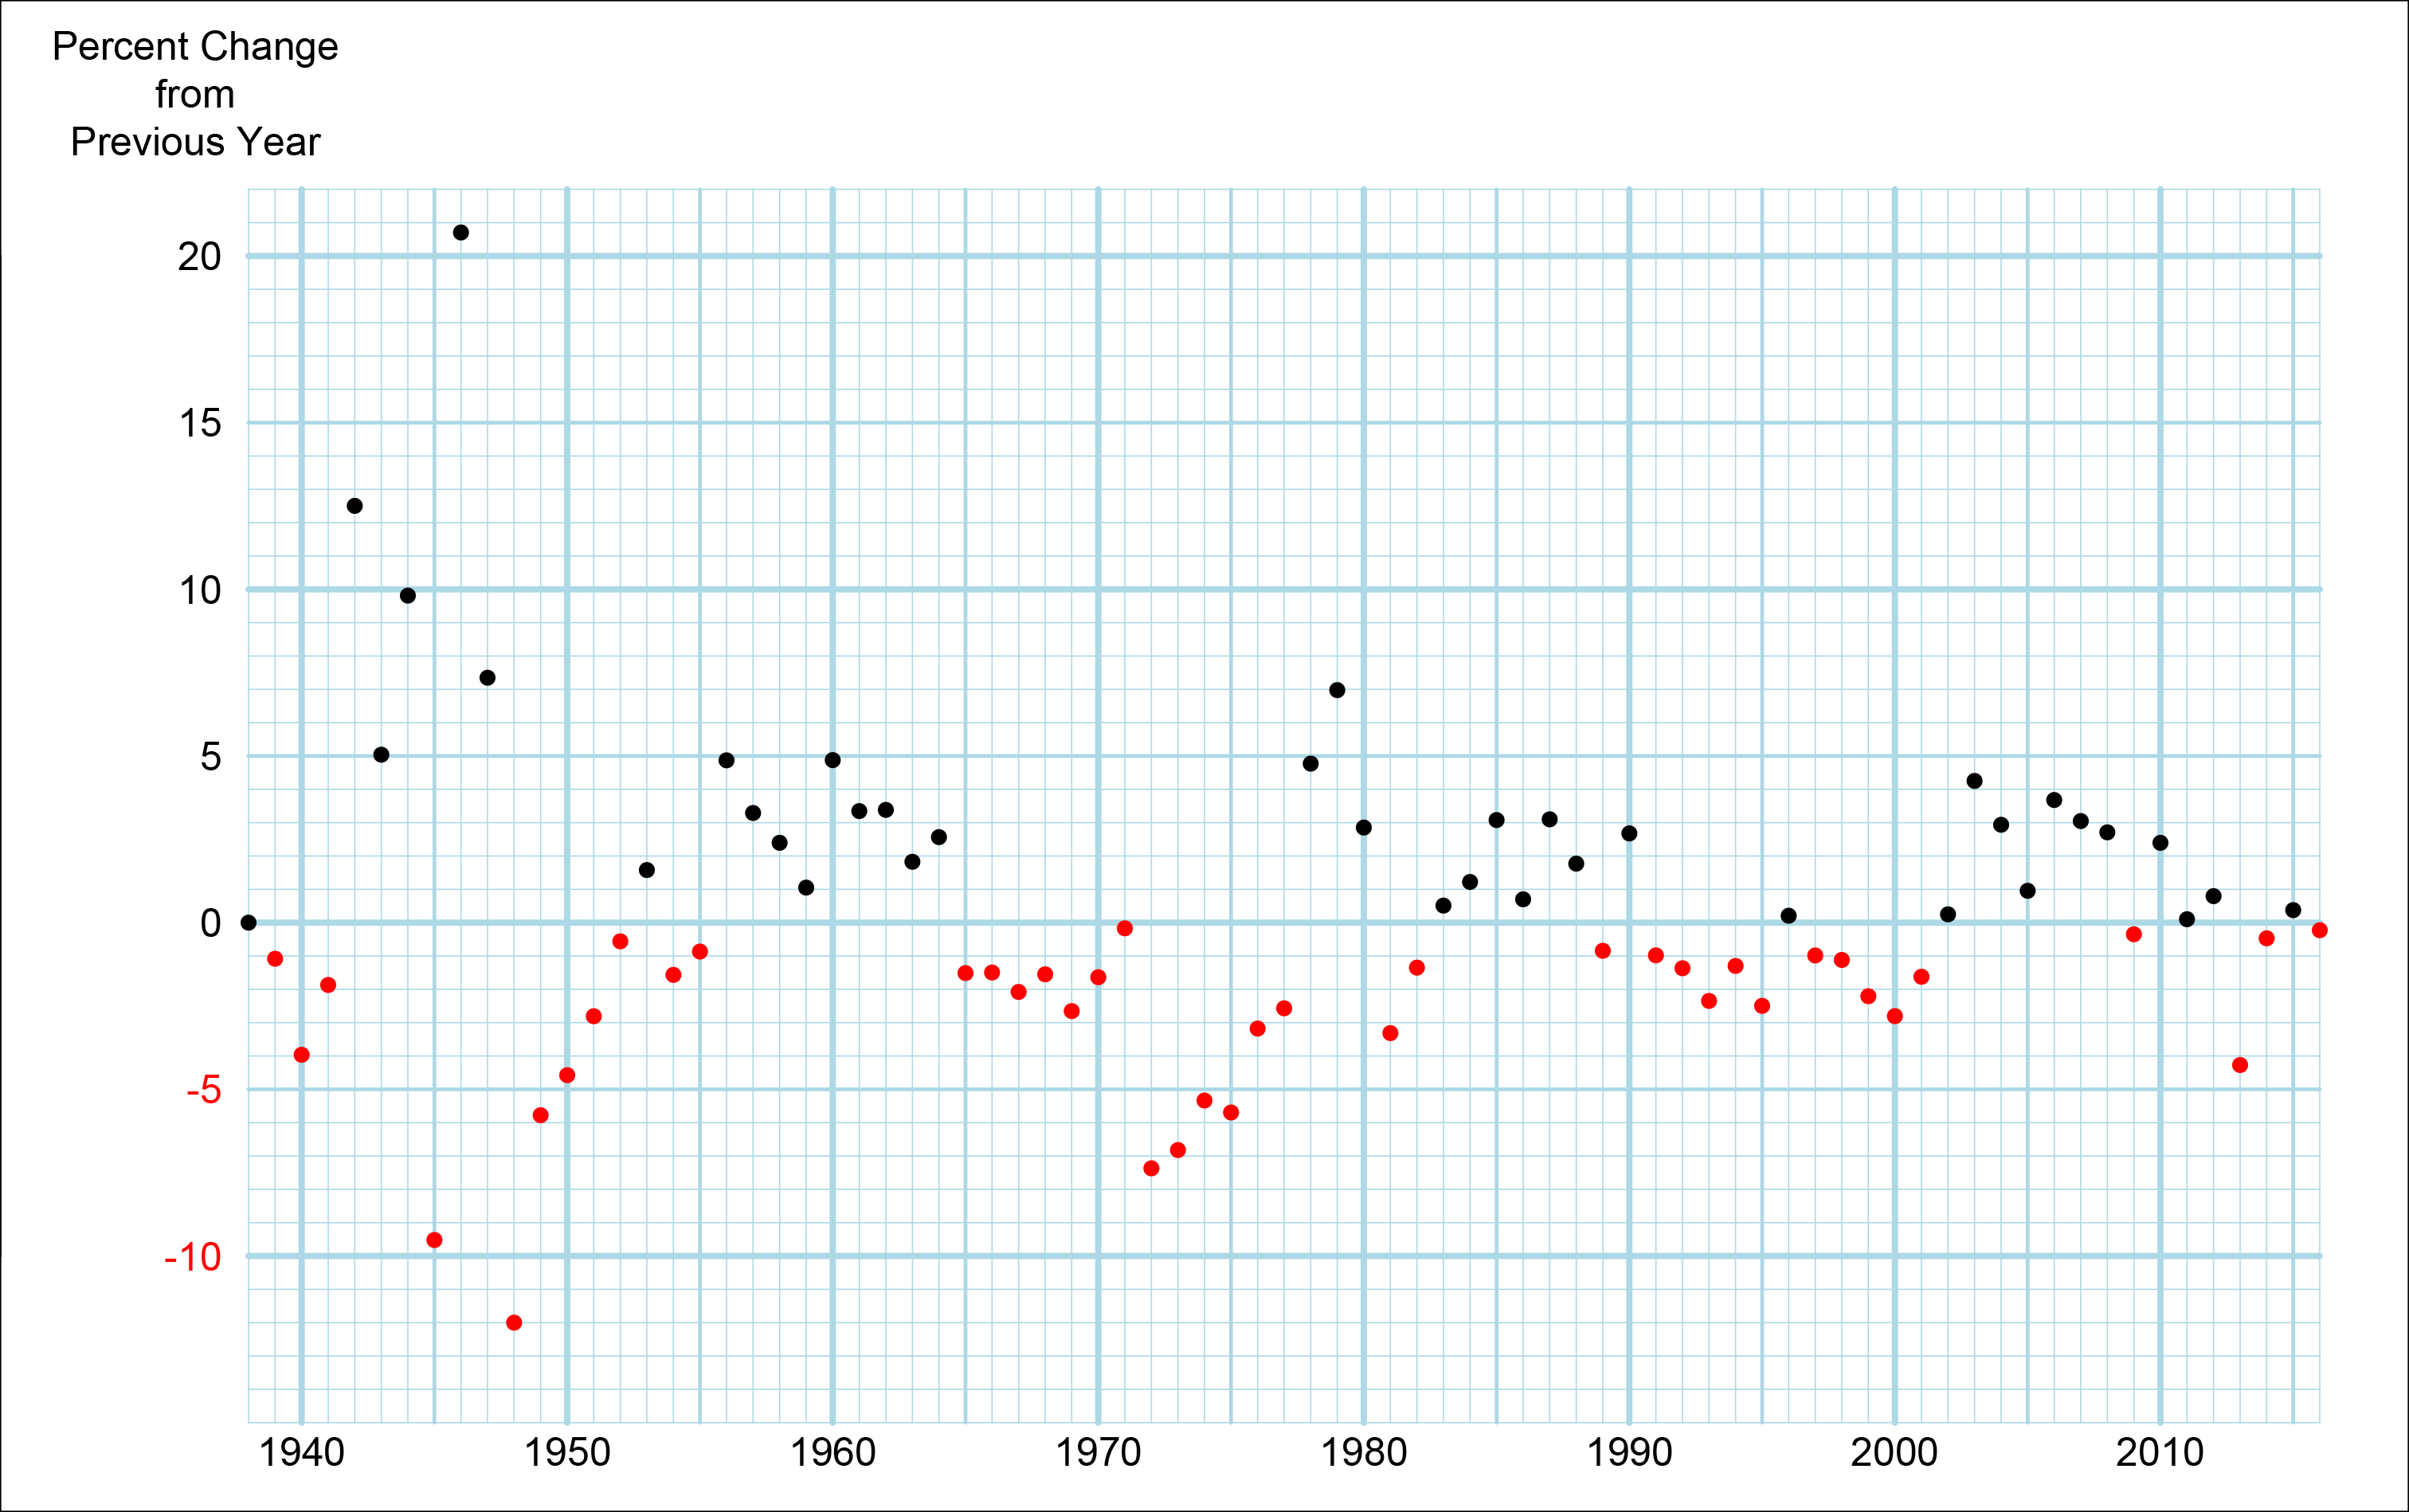
FIGURE 2 Year to year fluctuations in the numbers of live births in England and Wales, 1938-2016, derived using online data from the Office for National Statistics.
For our own forecast, we have considered the recent changes in the size of the England and Wales child-bearing population, which month the royal birth is expected, and the many unknowns. Our individual ‘best’ estimates of the number who will share the royal birthday in 2018 are 1,900 (SA) and 1,950 (JH).
Once the correct number is known (and that may not be until 2019), the editor of Significance will gift a year’s free subscription to the best and earliest forecast. If there is a tie, the prize will be given for the entry that the Significance Editorial Board considers is based on the most convincing statistical model.
About the authors
Shomoita Alam is a PhD student in statistics at McGill University, Montreal, Canada.
James Hanley is a professor in the Department of Epidemiology and Biostatistics at McGill University, Montreal, Canada.
References
1. Cortina Borja, M. and Martin, P. What is the most popular birthday in England and Wales? ^^
2. The mystery data challenge. Significance, April 2017. ^


