

Bradley Efron (pictured) was awarded the 2018 International Prize in Statistics for the creation of the “bootstrap”, a method that “transformed science’s ability to use and understand data and helped usher in the era of data analysis through computing”. But what is the bootstrap? James J. Cochran explains.
The term bootstrap is defined in many ways. Depending on the context, bootstrap could mean a loop on the back of a boot that can be used to pull the boot onto your foot, or it could refer to a popular open-source front-end framework for designing websites and web applications, or it could be used more generally to refer to any self-starting process (to pull one up by one’s bootstraps). In the context of statistics, the bootstrap is an important concept that greatly extends the usefulness of the discipline.
The concept of the bootstrap was introduced by Bradley Efron in his 1979 article, “Bootstrap Methods: Another Look at the Jackknife.1 The abstract of this paper explained:
We discuss the following problem: given a random sample X=(X1,X2,⋯,Xn) from an unknown probability distribution F, estimate the sampling distribution of some prespecified random variable R(X,F), on the basis of the observed data x. (Standard jackknife theory gives an approximate mean and variance in the case ![]() , θ some parameter of interest.) A general method, called the “bootstrap,” is introduced, and shown to work satisfactorily on a variety of estimation problems. The jackknife is shown to be a linear approximation method for the bootstrap. The exposition proceeds by a series of examples: variance of the sample median, error rates in a linear discriminant analysis, ratio estimation, estimating regression parameters, etc.
, θ some parameter of interest.) A general method, called the “bootstrap,” is introduced, and shown to work satisfactorily on a variety of estimation problems. The jackknife is shown to be a linear approximation method for the bootstrap. The exposition proceeds by a series of examples: variance of the sample median, error rates in a linear discriminant analysis, ratio estimation, estimating regression parameters, etc.
From this relatively innocuous beginning arose a revolution in statistics and data analysis. According to research by Cornell University’s College of Agriculture and Life Sciences and EPAM Systems, Efron’s method has been referenced in more than 200,000 peer-reviewed journal articles since 1980, and in November 2018 he was awarded the International Prize in Statistics (IPS) for the creation of the bootstrap.
How it works
The underlying principle of the bootstrap is deceptively simple. Relatively small samples generally provide very reliable information about the shape of the populations from which they are drawn, even though a sample may not provide reliable information about other characteristics of a population. Using the bootstrap method, we treat this sample as a population and take repeated samples with replacement from it; these are referred to as bootstrap samples. These bootstrap samples provide us with reliable insight into important characteristics of various sample estimates, and they enable us to construct reliable confidence intervals and conduct valid hypotheses tests.
In its press release, the IPS gives the example of a researcher wanting to calculate the average household income in a city. A survey of all households is unaffordable and impractical, so 100 households are randomly sampled. This sample produces an average household income of $29,308. The next step is to estimate how accurate that average is. To do this using the bootstrap, a random sample of 100 household incomes is drawn from that original sample of 100 household incomes.
“You can imagine writing each of the original incomes on a slip of paper, putting the slips into a hat and randomly drawing a slip out,” says the IPS. “Record the number, put the slip back into the hat and repeat this process 99 more times. The result would be a bootstrap data set, and we can make as many bootstrap data sets as we wish, each time taking their average. Let’s say we do 250 of them, giving 250 bootstrap averages. The variability of the 250 averages is the bootstrap estimate of accuracy for the original estimate $29,308.”
The bootstrap in context
Most introductory statistics courses teach us what are called parametric statistical methods. The reliability of a parametric statistical method depends on the validity of an underlying probability distribution and a small set of its characteristics, which are referred to as parameters. For example, the parameter of the Poisson distribution, often denoted λ, is the mean number of occurrences during a fixed period of time. Thus, if the random variable we are interested in is the number of people who arrive at our restaurant on Thursday between 6pm and 7pm, and we know this variable is Poisson distributed with a mean arrival rate of 50 per hour, the parameter is λ = 50. The normal distribution has two parameters, the mean and standard deviation, which are usually denoted as μ and σ respectively. Thus, if the random variable we are interested in is the height of healthy adult Canadian males, and this variable is normally distributed with a mean of 70 inches and a standard deviation of 3 inches, the parameters are μ = 70 and σ = 3.
If the underlying probability distribution and parameter(s) that we suspect to be correct do accurately describe the population from which a sample is to be drawn, this will provide reliable insight into important characteristics (such as the variance and bias) of various sample estimates such as the sample mean and sample median. This also enables us to construct reliable confidence intervals and conduct valid hypotheses tests.
However, if the underlying probability distribution and parameter(s) that we suspect to be correct do not accurately describe the population from which a sample is to be drawn, this will likely provide misleading information into important characteristics of various sample estimates. Under these circumstances, confidence intervals are not valid and hypotheses tests are not reliable.
One way to address this issue is to use statistical methods that do not rely on the validity of an underlying distribution; these methods are often referred to collectively as distribution free or nonparametric methods. The obvious question at this point is, “If nonparametric methods do not rely on the validity of an underlying distribution, why not use them for all problems?” The answer is relatively simple: if the distribution that the parametric method relies upon for its validity does indeed exist, the parametric method will generally be more likely than a nonparametric method to provide meaningful information and identify an effect that actually exists.
Thus, if we are not confident of the underlying distribution of an otherwise appropriate parametric method, we may elect to use a nonparametric approach. For example, the Wilcoxon Rank Sum Test is used as an alternative to the two-sample t-test for independent samples when the two underlying populations are not normally distributed. Many nonparametric methods have been developed for very specific circumstances; a few select nonparametric methods are applicable across a wide range of circumstances. The bootstrap is one such nonparametric method, and despite its simplicity, it is surprisingly powerful. It is generally more reliable (often much more so) than a parametric approach when the distribution the parametric method relies upon for its validity does not exist, and it is often almost as reliable as a parametric approach when the distribution the parametric method relies upon for its validity does exist. Thus, the bootstrap can be applied to a wide range of statistical problems, performs better than parametric alternatives in many instances, and performs almost as well as parametric alternatives in most other instances.
The bootstrap took time to become an essential component in the statistician’s tool belt, primarily due to computational limitations; the bootstrap requires the selection and some analysis of a large number of bootstrap samples, and contemporary computers, algorithms, and software generally were not capable of handling these computational demands in the late 1970s and early 1980s, soon after Efron published his paper. But as the capacity of contemporary computers, algorithms, and software improved throughout the 1980s and 1990s, the bootstrap rapidly grew in importance and frequency of application (see Figure 1).
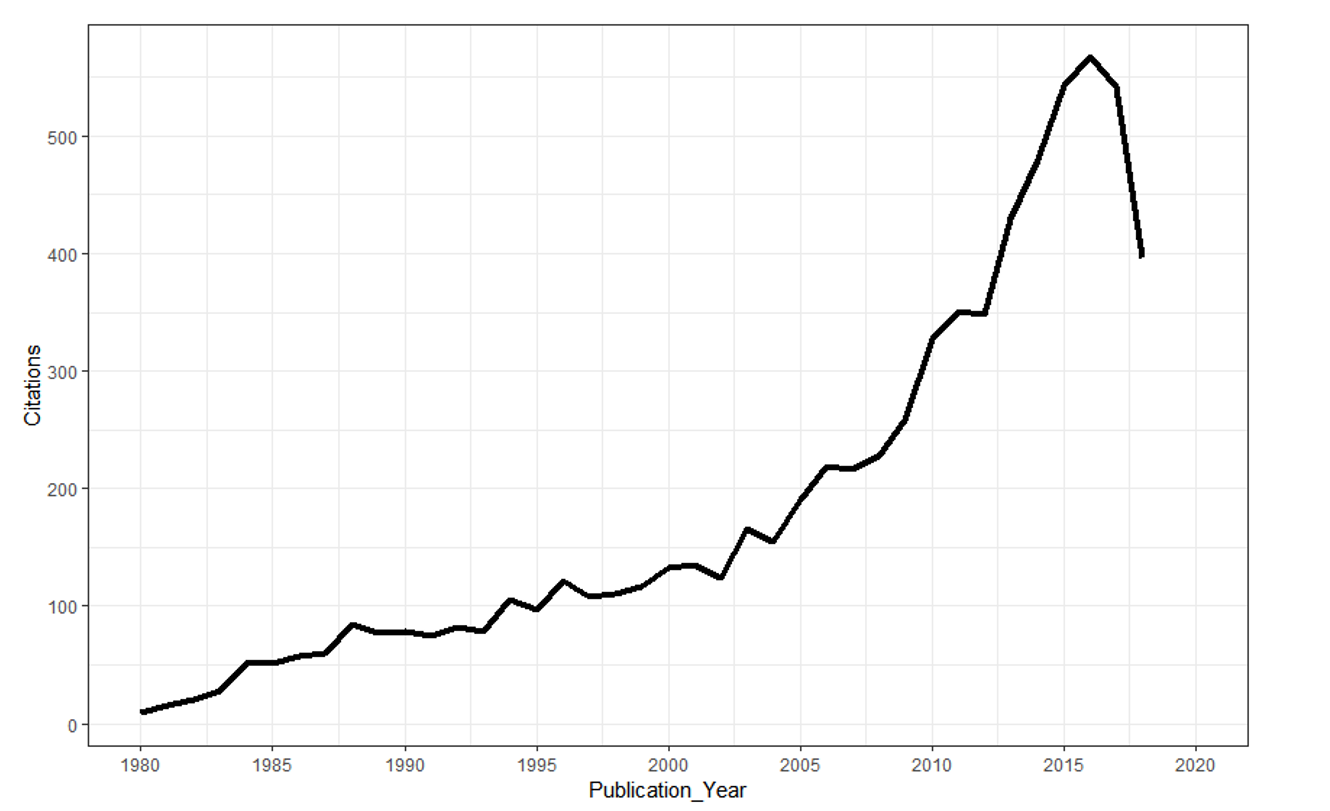
FIGURE 1 Number of citations of Efron’s 1979 paper1 by year of publication; data from ISI World of Science (> 7200 citations).
It is not an exaggeration to say that Efron’s insight has dramatically extended the range of statistics and has enabled us to address statistical problems that would otherwise remain beyond our reach. He told the IPS: “The truth is, I didn’t think it was anything wonderful when I did it. But it was one of those lucky ideas that is better than it seems at first view.”
Indeed, as Harvard University’s Xiao-Li Meng says: “While statistics offers no magic pill for quantitative scientific investigations, the bootstrap is the best statistical pain reliever ever produced.”
About the author
James J. Cochran is associate dean for research, professor of applied statistics and the Rogers-Spivey faculty fellow at the Culverhouse College of Business, University of Alabama. He is vice-chair of the Significance Editorial Board.
Reference
- Efron, B. Bootstrap Methods: Another Look at the Jackknife. Ann. Statist. 7 (1979), no. 1, 1–26. doi:10.1214/aos/1176344552. ^


