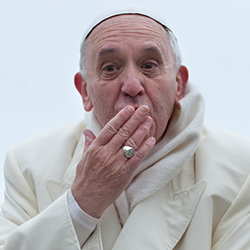
Like other populations, popes have experienced a generally increased life expectancy – but statistically, how many years can the present pope expect to live after his election? To answer this question we analysed data on the post-election survival times of popes, starting with Pope Innocent VII, whose pontificate began in 1404.
We arbitrarily started at the beginning of the fifteenth century as dates of birth, election and death (or resignation) are well documented from that century onwards. The resulting data set is based on the 62 popes before Pope Francis. Note that apart from Gregory XII and Benedict XVI – who choose to resign the papacy in 1415 and 2013, respectively – all the popes analysed died in office.
After an initial analysis of the data, we modelled ti, the post-election survival time of the i th pope in our data set, using a Weibull survival model – a common model for positive times to events. Our data included one observation that is censored – that is, the pope in question (Pope Francis’s predecessor, Pope Emeritus Benedict XVI) is still alive. Effectively, we have a lower bound on his survival. Our model also had two centred covariates: age at election (x1i) and year of election (x2i), both of which were centred by the subtraction of the sample mean. Our model took the form:
For most popes in our data set the postelection survival time is the same as pontificate length. The exceptions are Pope Gregory XII and Pope Emeritus Benedict XVI. We performed inference in the Bayesian framework, and so we needed to specify prior distributions for needed to specify prior distributions for the unknown parameters in our model, r, β0, β1 and β2:
There was no posterior support for an interaction term between age at election and year of election. Our inference is thus based on the posterior distribution of the unknown parameters given the data:
We simulated 500 000 values of r, β0, β1 and β2 from this posterior distribution using a Markov chain Monte Carlo algorithm implemented in JAGS1 using R2jags2. Figure 1 shows posterior distributions of the median post-election survival time for hypothetical popes elected in 1750 and 1950, aged 60 and 80 at the time of election. The graphs suggest that, as the years have passed, the median survival time has increased somewhat. Naturally, popes who are older at the time of their election tend to have shorter pontificates.
Figure 1. Posterior distributions of the median post-election survival time for popes elected in 1750 and 1950, aged 60 and 80 when elected.
Pope Francis was 76 years old when elected in 2013. His pontificate has so far lasted 2.89 years at the time of writing (February 2016). We can understand the future survival time tnew of a pope such as Pope Francis by considering the predictive probability density function:
We can use the sample from the posterior density, , together with simulations from an appropriate Weibull distribution, to generate values from this predictive distribution. Figure 2 shows the predictive probability density function of the post-election survival time for a pope such as Pope Francis. The median survival time is 10 years, with the 0.95 quantile being approximately 25 years.
Figure 2. The predictive probability density function of the post-election survival time for a pope elected in 2013, aged 76, who, like Pope Francis, has already served 2.89 years).
We therefore conclude that the forecast made by Pope Francis in 2014 about his own survival seems rather pessimistic: based on the survival of past popes, he can expect to live at least 10 years with probability 50%, and 25 years with probability 5%.
Of course, there is scope for more sophisticated analysis of papal postelection survival times. In addition, similar analyses could be conducted for individuals comprising different special populations, such as monarchs and other heads of state. Note, however, that unless we are dealing with leaders that have all been male, such as presidents of the United States, a covariate indicating gender must be included.
- Julian Stander is associate professor (reader) in mathematics and statistics in the School of Computing, Electronics and Mathematics, Plymouth University. Luciana Dalla Valle is a lecturer in statistics in the School of Computing, Electronics and Mathematics, Plymouth University. Mario Cortina Borja is chairman of the Significance editorial board, and professor of biostatistics in the Centre for Paediatric Epidemiology and Biostatistics, UCL Institute of Child Health.
- This article was originally published in the February 2016 print edition of Significance. The magazine is available on subscription, via iOS and Android app, or as part of the membership package of the Royal Statistical Society and American Statistical Association.
References
- Plummer, M. (2003) JAGS: A program for analysis of Bayesian graphical models using Gibbs sampling.
- Su, Y.-S. and Yajima, M. (2015) R2jags: Using R to Run “JAGS”. R package version 0.5-6. http://cran.r-project.org/package=R2jags


