But are annual variations in the frequency of conceptions the only factor that determines the number of babies born on a particular day in the year? In this short article, we show that the daily number of live births also varies by day of the week, and that it is influenced by both movable and non-moving public holidays (see “Days off”). We analyse data provided by the ONS on all live births recorded in England and Wales between 1 January 1979 and 31 December 2014 – from the earliest date where daily birth frequencies are available, to the latest available at the time of writing.
These 36 years of data cover almost 29 million births. The daily average for the entire period was 1816 births. The day with the lowest number of recorded births was Boxing Day, 26 December 1979, when 1123 babies were born. The single most popular birthday was 27 September 2012, which saw 2383 births.
To examine the popularity of dates of birth from 1979 to 2014, we averaged the numbers of live births of all dates across the 36 years; the results are displayed in Figure 1. The second half of September and the first week of October feature the highest mean number of births. The most popular birthday in our 36-year analysis is 25 September; very close to but not the same as the date recently identified by the ONS in its analysis of 20 years of data.
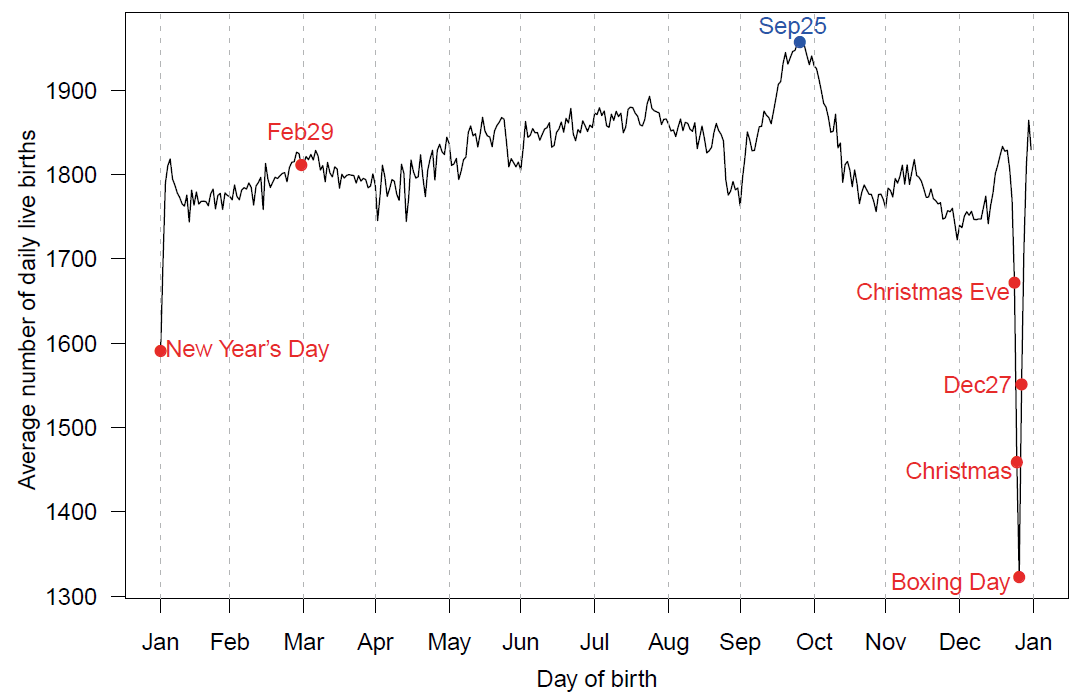
Figure 1. Mean frequencies of live births by birthday in England and Wales, 1979–2014
Naturally, the leap year day of 29 February has by far the smallest aggregated frequency, because it occurs only nine times in the 36 years; but the average frequency for this day is close to that of other days in late February and early March. The six days with the lowest average frequencies all fall on or around Christmas and New Year. Currently, 2.3% of maternities in England and Wales take place at home and this figure has fluctuated between 0.9% and around 4% in the period of interest, as shown by Nove et al.1
It is reasonable to assume that low numbers on and around non-moving public holidays – such as those over the Christmas and New Year period – are largely caused by the patterns that health services management impose on dates of birth: for instance, planned caesarean sections are generally not scheduled on weekends or public holidays, when fewer staff are available than on ordinary weekdays.
We see, then, that people’s birthdays depend not only on the time at which they are conceived and the length of gestation, but also on the timing of interventions by maternity services.
This is shown in Figure 2, which answers the question: what was the most popular birthday in each year between 1979 and 2014?
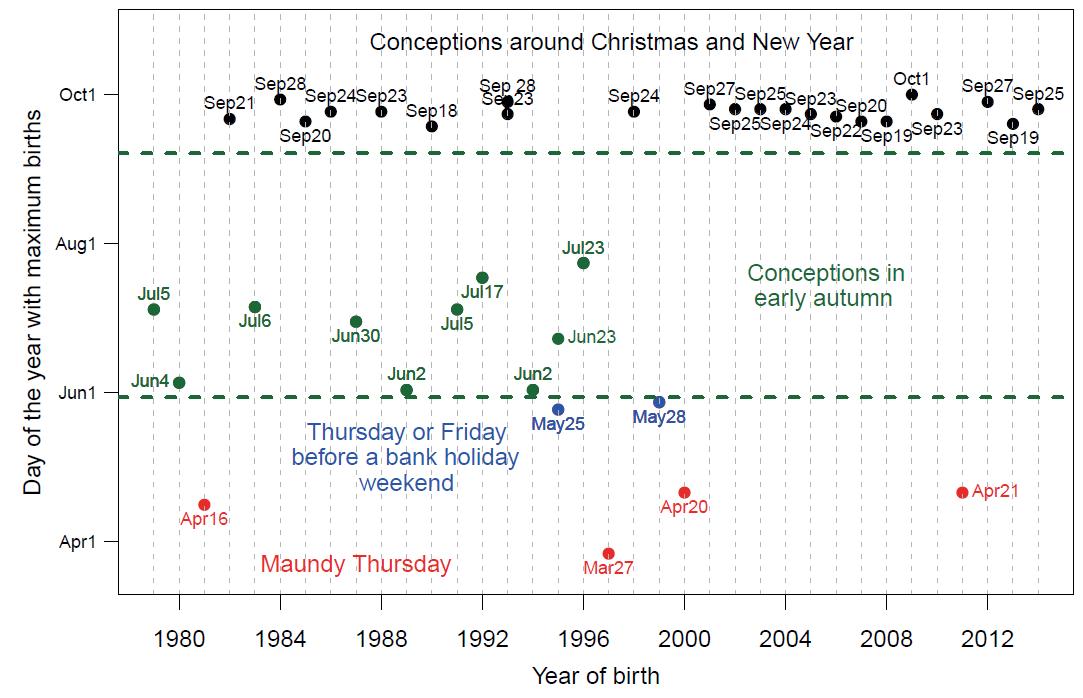
Figure 2. Dates of maximum number of live births in each year in England and Wales, 1979–2014
The years divide into four groups:
- In the majority of years, the most frequent birthday fell between 18 September and 1 October (in 1993, there was a tie between 23 and 28 September).
- In ten of the years, the most frequent birthday fell between 2 June and 23 July (in 1995, there was a tie between 23 June and 25 May).
- A day in late May saw the most births in two of the years (one of which was 25 May 1995, as noted above).
- Finally, four of the years featured a day in early spring as the most popular birthday.
It is interesting to consider the last two groups, because they feature days outside the two seasonal peak periods of the year. The two dates in May correspond to a Thursday and a Friday immediately before a bank holiday weekend. The four dates in late spring are all Maundy Thursdays (the day before Good Friday), and very likely reflect a high number of caesarean sections and induced births scheduled in hospitals in anticipation of a four-day holiday. After 2001, all but one of the dates with the maximum number of births occur in late September or early October.
Finally, the most popular birthday in a year also depends on the way the days of the week happen to fall, because when it comes to birthdays, not all days are the same. Among the 38 most popular birthdays in our 36 years, 17 were Thursdays, 12 were Fridays, five were Tuesdays and four were Wednesdays. None were Mondays, Saturdays or Sundays. Interestingly, in the last six years of our reference period, the most popular birthday was always a Thursday.
Figure 3 shows the mean number of live births by day of the week in which they occurred. Christmas/Boxing Day (“Xmas”) and all other public holidays (“Hol”) have been coded as separate categories (so that, for example, Good Friday is counted as a public holiday, not a Friday). The most popular day to be born is Friday, followed very closely by Thursday, Wednesday, and Tuesday. Mondays tend to have fewer births than other weekdays. Saturdays, Hols and Sundays have even fewer births, and once again we see that Xmas has the lowest.
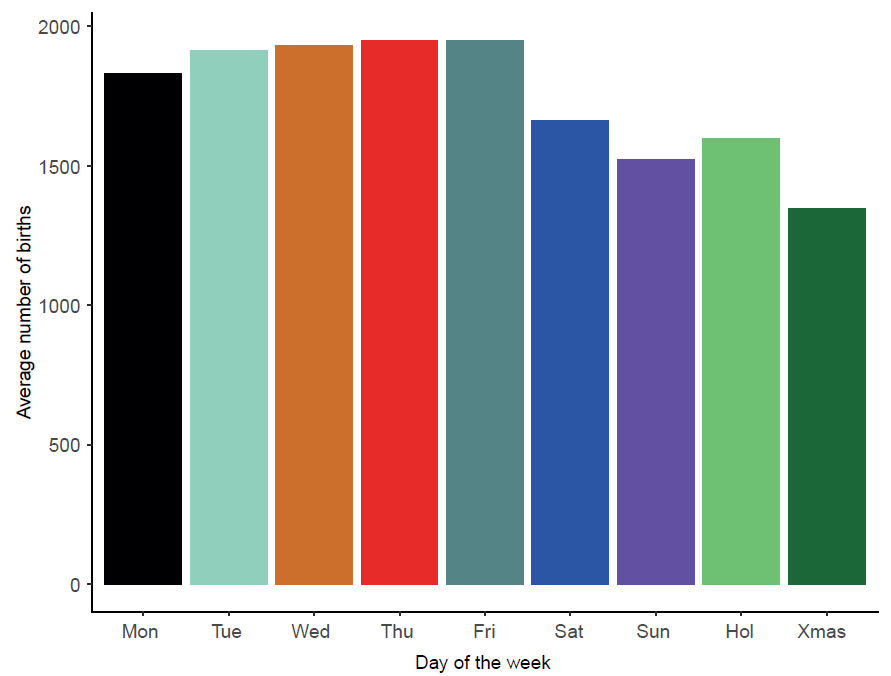
Figure 3. Mean number of live births by day of the week in England and Wales, 1979–2014
The distribution of birthdays by day of the week has changed during the period we are investigating. This is shown in Figure 4. Throughout, Mondays (excluding public holidays) have fewer birthdays than any other weekday, but the gap has become smaller in the last 15 years. Public holidays (excluding Xmas) used to have similar numbers of births as Saturdays, but have been closer to Sundays since the year 2000. Meanwhile, over the same period, the gap between Saturdays and Sundays has substantially decreased. Consistent with Figure 2, Thursday beat Friday to the title of “most popular weekday to be born” in the last six years of our dataset.

Figure 4. Trends in mean number of live births by day of the week in England and Wales, 1979–2014
It would be interesting to explore whether these trends relate to changes in policy and practice in maternity hospitals – and specifically, how rates of caesarean sections and inductions have changed over time, since such interventions are strongly related to the date (and time) of birth. Such detailed analyses fall outside the scope of this brief note but are discussed in Macfarlane et al., among other sources.2
Knowing the distribution of birthdays might be fascinating in itself, and might allow shops to anticipate when they need to stock up on birthday cards. But there are more serious purposes of studying birthdays: observational evidence suggests that the date of birth influences neonatal and even adult health. We mention three examples, among many:
- Doblhammer and Vaupel (2001) found that people born in the autumn of the Northern Hemisphere have an increased life expectancy compared to those born in spring; in the Southern Hemisphere this pattern is shifted by six months, so that again babies born in the Southern autumn have the longer life expectancy. There are many hypotheses about potential mechanisms for this seasonal effect, e.g. seasonal maternal malnutrition, environmental insults in utero, prevalence of infections during pregnancy, but none has been conclusively tested.3
- Salib and Cortina-Borja (2006) showed that people born in England and Wales in April, May and June are at a higher risk of suicide than people born at other times of the year.4
- The wet season in the Gambia (July–October) coincides with an annual hungry period when staple foods from the previous harvest are seriously depleted. Moore et al (1997) showed that people born in the wet season are much more likely to die prematurely in young adulthood. They speculated that a permanent effect of malnutrition on the development of the immune system during foetal growth might explain this phenomenon.5
Referring, in general, to the effects of seasonal patterns on health, Lawlor (2004, p. 146) points out that public health practitioners “cannot dictate the seasons during which individuals are born.6 However, we can use our findings to identify policy interventions aimed at reducing nature’s global and local inequalities.” There is much research yet to be done to inform this laudable aim.
- Mario Cortina Borja is chairman of the Significance editorial board, and professor of biostatistics in the Population Policy and Practice Programme, Institute of Child Health, University College London.
- Peter Martin is a research fellow at City, University of London, and teaches statistics at the Anna Freud National Centre for Children and Families.
- An edited version of this article was first published in our February 2017 issue. Click here to subscribe to Significance.
References
- Nove, A., Berrington, A. and Matthews, Z. (2008) Home births in the UK: 1955–2006. Population Trends, 133, 20–27. ^
- Macfarlane, A., Mugford, M. and Henderson, J. (2000) Birth Counts: Statistics of Pregnancy and Childbirth. London: The Stationery Office. ^
- Doblhammer, G. and Vaupel, J. W. (2001) Lifespan depends on month of birth. Proceedings of the National Academy of Sciences of the USA, 98, 2934-2939. ^
- Salib, E. and Cortina-Borja, M. (2006) Effect of month of birth on the risk of suicide. British Journal of Psychiatry, 188, 416-422. ^
- Moore, S. E., Cole, T. J., Poskitt, E. M. E., Sonko, B. J., Whitehead, R. G., McGregor, I. A. and Prentice, A. M. (1997) Season of birth predicts mortality in rural Gambia. Nature, 388, 434. ^
- Lawlor, D. A. (2004) Commentary: the art and science of epidemiology: governed by the seasons? International Journal of Epidemiology, 33, 144-146. ^


