Investigating the impact of extreme temperatures on women’s mortality: a curious case study from India, underscoring the need for global data equity
Are women at higher relative risk of mortality from the effects of climate change and global warming than men? Does sociocultural context matter?
The evidence from the existing literature suggests this may be true in the global north, but the findings from studies in the global south are not so clear. We employ 30 years of extreme-temperature-related mortality data to explore this question in India, and call for collection of more granular ambient and personal exposure data on vulnerable subpopulations across the world.
Insufficient data is hindering proper analysis of this question. Moreover, mortality data has its own reporting challenges, often having differential accuracy – female deaths are not officially reported and medically certified with the same fidelity as male deaths. Data equity can help in closing this gap. Data equity is a term used to describe an ethos that everyone, regardless of their background and beliefs, should benefit equally from data resources and data products, both in terms of availability and quality of data. We argue that data equity is a critical pillar of climate equity, health equity and, more broadly, for societal equity.
Why care about gender?
There is strong evidence to support that women bear a greater adversarial burden from extreme weather events compared to men. Recent UN estimates reveal that almost 80% of individuals impacted by climate-induced displacements and consequent adversaries are female.1 However, statistical evidence on the gender-specific effects of extreme temperature change remains ambiguous and widely varied in the extant literature. The limited systematic review and meta-analyses of global research on the interaction between gender and climate impact yield mixed results.2,3 Current studies present conflicting views on gender-specific mortality rates from temperature changes. While some studies show males have higher mortality than females or vice versa, there are also studies that indicate no differences in gender due to extreme temperatures. Furthermore, there appears to be a variation in data and evidence from studies in the global north versus the global south (see Supplementary Tables S.1 and S.2). Note that, according to the United Nations, the global north refers to developed economies, the global south to developing economies.4
Studies in the global north (Supplementary Table S.1) have stronger evidence in support of women being at higher risk of weather-related mortality, with no studies concluding that men are at higher risk than women. However, we see in Supplementary Table S.2 that from the 16 studies that are summarised from the global south, 7 conclude women are at high risk, 6 conclude the opposite and 3 declare no significant difference between men and women in terms of temperature-related mortality. What explains this variation? Is it the quality and size of the studies, choice of analytical methods, or a true unmasked geospatial difference? Such statistical divergences are concerning, as without a clearer understanding and precise evidence, efforts towards climate action can become ineffective, particularly in reaching vulnerable sub-groups.
Presently, there is a growing body of evidence linking extreme temperatures to a rise in global mortality rates.5 Generally, the relationship between temperature and mortality varies depending on local climatic conditions, lifestyle differences, and demographic and socio-economic factors, such as poverty or access to cooling methods. Currently there is qualitative evidence on asymmetry in access to mechanical cooling methods such as air conditioning units or fans in the global south, with women having lesser agency in operating them.6 Recent estimates suggest that globally 50% more women than men do not have access to any form of cooling.7 Most literature that exists on temperature-mortality relationships are concentrated on developed countries in the global north, where extreme temperature, especially heat, is incomparable to that in the tropical regions of the global south.8 Consequently, the results from statistical inference of any reported gendered effects of temperature from the bulk of literature cannot be easily generalized to the global south.
In this pretext, it is urgent to comprehensively understand and address the gender disparities in mortality trends resulting from extreme temperature fluctuations in developing countries. This is crucial because establishing accurate benchmarks for impact assessments is an absolute necessity for targeted prevention. Furthermore, the design and conceptualisation of climate adaptation pathways primarily hinge upon having a clear starting point, and then designing contextually tailored strategies to build resilience in high-risk subgroups. Given that the climate impacts are compounded by the regional differences in gender-specific mortality, there is a pressing need for more in-depth investigations in these understudied regions of the world where the current evidence is highly heterogeneous.
In tropical countries like India, temperature extremes far exceed the global average.9,10 Women in these areas are especially at risk, and marginalised due to rigid cultural norms and societal expectations, which limit their ability to respond and cope effectively to extreme temperature risks.11 Therefore, addressing gender disparities in the temperature-mortality association, especially in burgeoning countries like India, is crucial. Such research could bridge a significant knowledge gap, encompassing a large at-risk population, and aid in protecting vulnerable groups.
Lack of granularity in temperature-health-mortality data
In the global south, tackling the complexities of extreme-temperature-related mortality means encountering a unique challenge: the absence of sufficient data granularity. For example, robust statistical inferences need an optimal resolution of measured data: temperature records, other meteorological data, and gender-specific mortality recorded at a fine spatio-temporal scale, allowing for a more precise characterisation of the interplay between gender and temperature on mortality trends.
Cause-specific mortality data in developing countries is porous where it is not uncommon for the majority of deaths to not be medically certified in the death registration system. Let us focus on India, the world’s largest democracy where almost one-fifth of the world population resides. For example in India, in 2019, only 19% of estimated deaths had a medically certified cause of death.12 Not surprisingly, India has insufficient granularity in temperature related health and healthcare data.13 This is primarily because there is no standardised methodology to report mortality and morbidity due to temperature change.14 The Indian government’s recent ‘Digital India’ initiative15, to provide services such as birth and death registrations, may be a potential solution. However, data sharing and data access policies from this platform are yet not available and it is not clear whether this platform will be a reliable resource for cause-specific mortality, in particular for extreme-temperature-related mortality. Hence, the data gaps have led to inconclusive evidence in gender-specific temperature change risks in India.16
Most research on gender and temperature change risks in India has been conducted in specific regions perceived to have higher at-risk subpopulations like populations from poor socio-economic class or belonging to rural areas. These observational studies with coarse ecological data suffer from reporting and aggregation biases that fail to account for confounding factors like variations in socio-economic conditions, educational attainment, type of occupation, neighborhood or locality, housing types, and access to adaptation mechanisms. Some of these studies conclude that women are more vulnerable than men17,18 , but the conclusions keep changing at various time points in the same cohort.19 Additionally, most evidence on gender-specific temperature change risks come from economic generation sectors like industry, agriculture, or informal daily wage labourers. There is no data on the population that mostly stays indoors. In countries like India, women spend 54% more time indoors than men20 and have self-reported higher temperature change tolerances than men.21 For reliable temperature-gender-mortality inferences, we need high resolution spatio-temporal data from nationally representative large data collection efforts. What we now have access to is “coarse” in the sense that it is measured at a very high level of aggregation.
Coarse analysis of available coarse data?
The authors of this article have extensive experience with health and climate data from India, thus we illustrate the data gap by using India as an illustrative example. Given the data paucity, one can wait for decades for the ideal national data to arrive, or we can start diving into what is available and explore if we find anything that immediately warrants future studies.
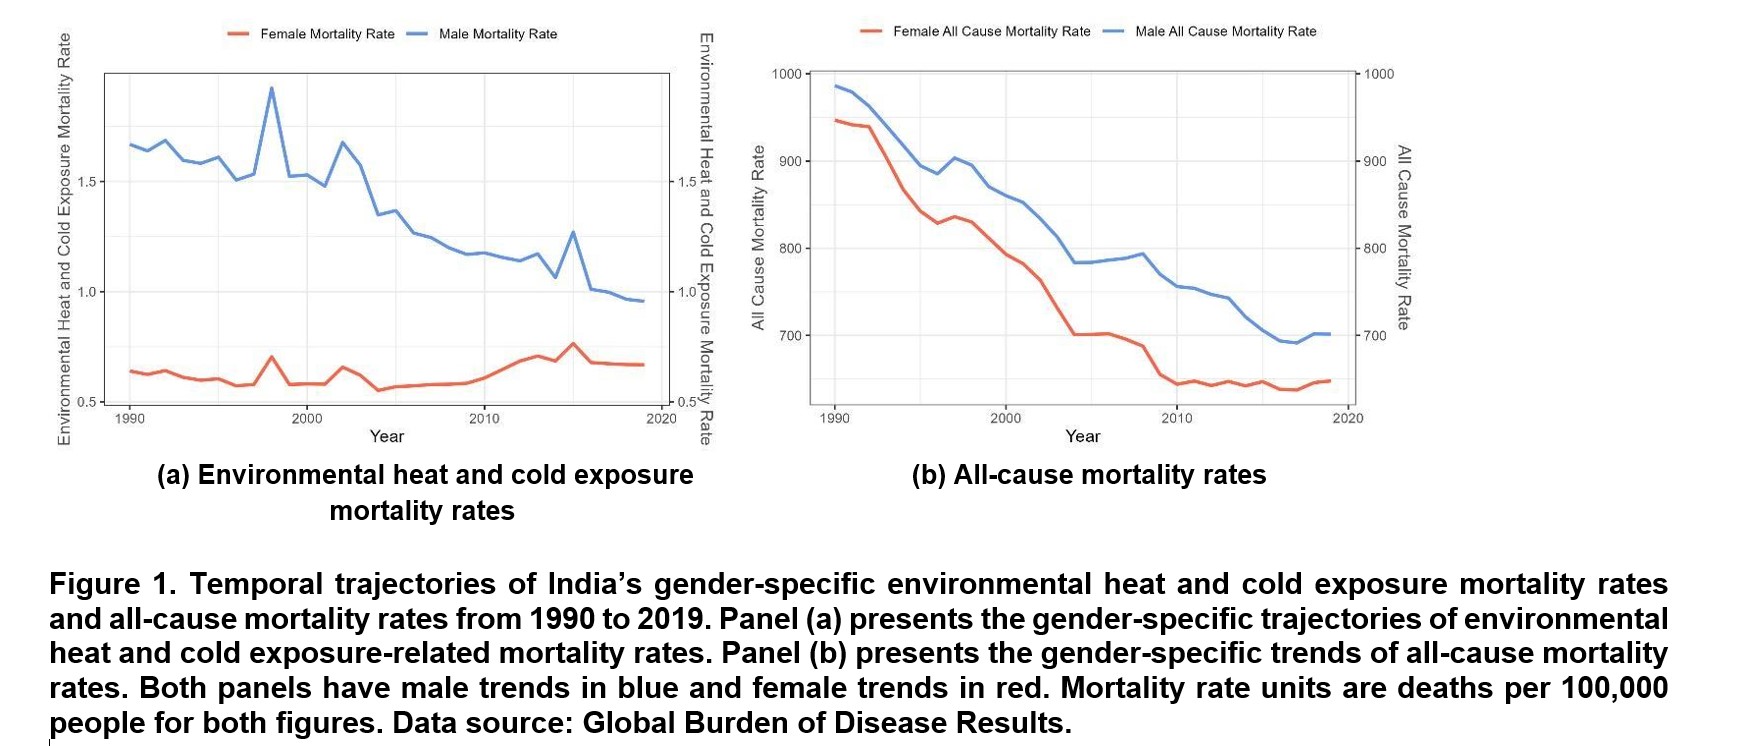
Gender stratified (weather-related) mortality data: We start by examining gender differences at an overall national level, utilising mortality data and population data extracted from the Global Burden of Disease Results (GBD Results).22 Specifically, we employed gender-specific environmental heat and cold exposure mortality counts (referred to as “mortality” for simplicity) along with population estimates for India. Mortality rates are also calculated with units of deaths per 100,000 people. It is worth noting that the GBD database provides annual nationwide estimates for gender-specific temperature-related mortality rates from 1950 to 2019 in India23 but lacks finer spatial and temporal granularity as we discussed in the previous section. It is an extremely crude form of summarising aggregated data. Moreover, female mortality is more likely to be underreported than male mortality in India, leading to differential measurement error for the two genders.24 Strong autocorrelation is observed in the available mortality data (see Supplementary Figures S.3).
Historic national temperature data: For temperature, we used India’s daily temperature data as recorded by the India Meteorological Department (IMD). Utilising the Python package “IMDLIB”,25 we accessed the daily mean, maximum, and minimum temperature records from 1990 to 2019, spanning the entire country at a spatial grid level of 1° latitude x 1° longitude. Upon inspecting the monthly averaged max temperature through the study period, summer months (April, May, June, and July) are chosen with months that have higher daily max temperatures compared to the other months (see Supplementary Figures S.1). July has a lower monthly average max temperature but is included given that IMD has reported multiple heatwave days during July. Similarly, winter months (December, January, and February) are chosen with months that have lower monthly average minimum temperatures through the study period (see Supplementary Figures S.2). The temperature data is available till 2023 but, as the GBD mortality data is only available up to 2019, we restrict the time range.
The average summer mean and maximum temperature, as well as winter mean and minimum temperature, are calculated. While a first order autocorrelation is observed in the monthly averaged temperatures (see Supplementary Figures S.6), autocorrelation is not observed after summarising daily temperature data into a crude annual aggregation (see Supplementary Figures S.4 and S.5).
Next, we identified and aggregated annual counts of hot days and cold days in India in a data-adaptive way, based on quantile values derived from historical daily maximum and minimum temperatures from 1990 to 2019. Hence, here, days with maximum temperatures equal to or exceeding the 90th sample quantile (36.10°C) are categorised as hot days, while cold days are defined by daily minimum temperatures equal to or falling below the 10th quantile (11.26°C). Again, this is a very crude measure of extreme temperature for a country that has a huge variation in national temperature on a given day.
Technically, hot and cold days, or summer and winter seasons, are defined by a period that requires cooling and heating respectively, where cooling degree hours (CDH) refer to the measure of how much (in degrees), and for how long (in hours), the outside temperature is above a certain baseline temperature in summer seasons when cooling will be required to maintain indoor thermal comfort. The CDH is a commonly used indicator to estimate the cooling loads occurring due to outdoor temperature. The baseline temperature varies significantly depending on the climate zone and there is no specific fixed baseline. For India, the baseline temperature for cooling degree hours is scientifically derived to be in the range between 6.8 °C and 28.6 °C, with 18°C being the average base temperature for assessing both hot or cold days.26 IMD declares a cold day or a hot day when the maximum temperature is lower or higher than the normal by 4.5 degrees or more. While thermal comfort and thermal stress are not directly correlated, thermal comfort determines thresholds of discomfort which if not mitigated may lead to severe health impacts. Here we use thermal comfort as a surrogate for heat stress.
A recent study on a three-decade surge in space-cooling demand across five global cities, primarily known for heating demand, shows an increased rate of cooling degree hours between 160 °C.h per year (maximum) and 25 °C.h per year (minimum).27 This indicates that the demand for cooling for human survivability across the world is increasing. Additionally, it is not just the temperature but also humidity that makes heat lethal. A wet bulb temperature threshold of 35 °C is often referred to as the threshold beyond which the human body fails to adapt to extreme heat. However, such thresholds that combine temperature and humidity are not currently used in practice by meteorological agencies to define summer and winter seasons.
The curious figure of mortality trends in India: The gender-specific mortality trajectories for heat and cold exposure in India show quite stark differences, (see Figure 1a). For example, amongst males, the decline in temperature-related mortality is gradual with certain spikes, while for females the mortality rate starts to show a gradual increase from 2005. The percentage relative change in gender-specific mortality rates reveal sharp contrast between genders: -23.11% for males (+4.63% for females) from 2000 to 2010, and -18.70% for males (+9.84% for females) from 2010 to 2019.
One may reject the apparent deduction from Figure 1a by noting that a lot of contemporaneous social forces are changing in India that could influence both female temperature-related mortality rates and weather events in the twenty-first century. This is an inherent and undeniable fallacy of such aggregated data and ecological analysis. However, the all-cause mortality rates show a declining trend across the 30-year period with recent plateaus for both genders (see Figure 1b). This can be attributed to a multitude of potential causes, including but not limited to advances in public health and medical care, better infrastructure, socioeconomic growth, and optimising the public’s resilience to various health hazards, including extreme weather events.28
To infer on the effects of specific environmental exposures more formally on mortality, we use gender-specific univariate quasi-Poisson generalised linear models (GLMs) to test our hypothesis aimed at assessing the equality of risk coefficient estimates between the constructed models. The results are presented in Table 1; coefficient values are presented in log rate ratios. In order to account for potential autocorrelation in mortality, gender-specific univariate quasi-Poisson GLMs with AR(1) error structure is also fitted via generalised estimating equations (GEE); results are shown in Supplementary Table S.3. Additional data and all used code are presented in additional Github data resources.
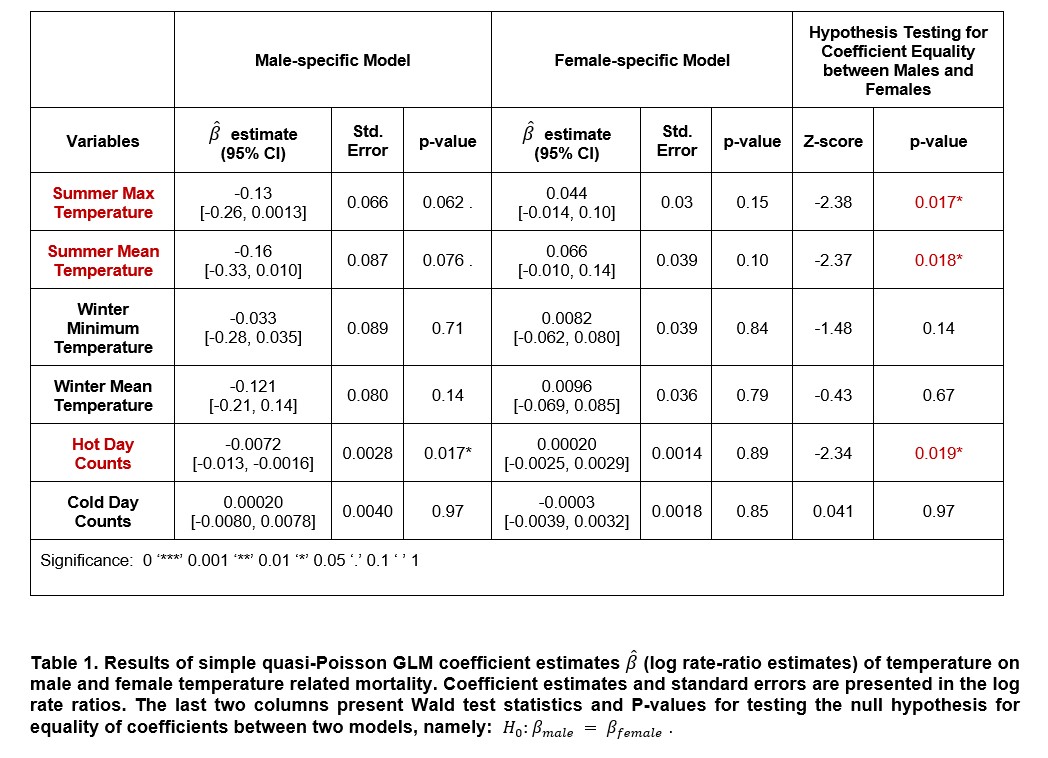
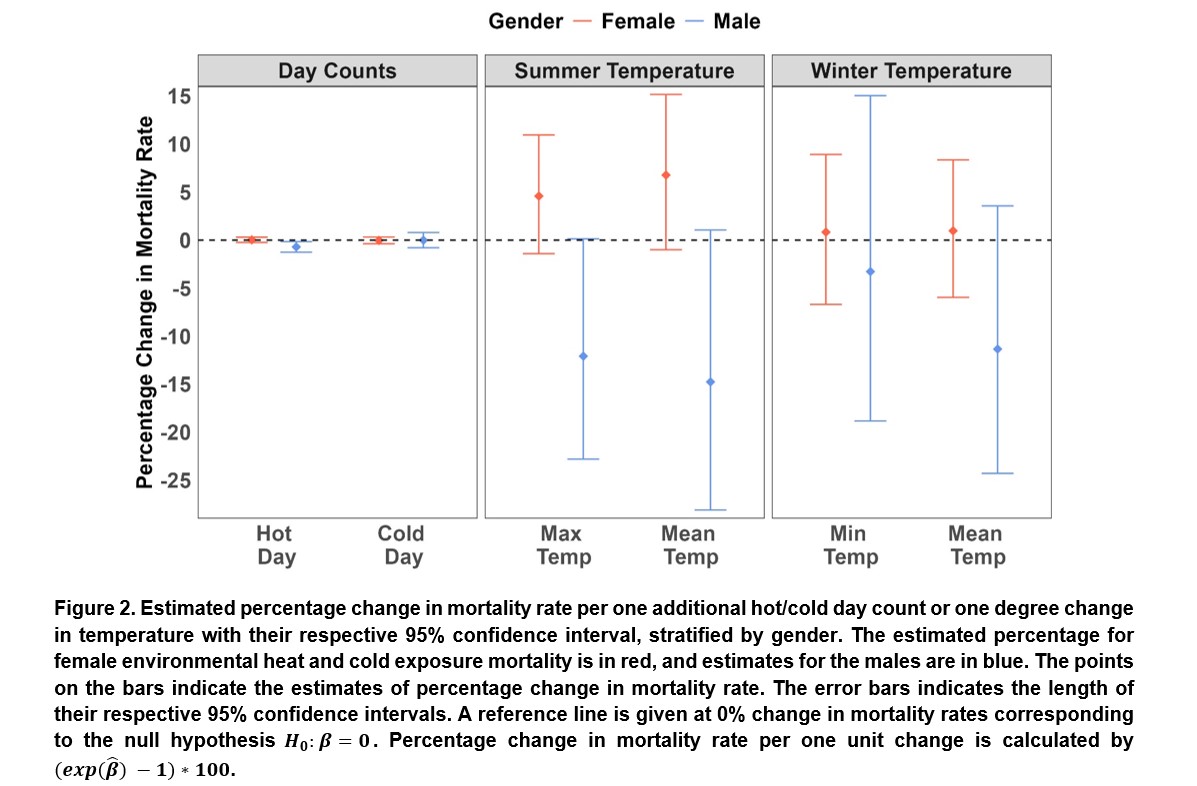
A simple correlation analysis of summer max temperature and gender-specific mortality rates reveal a positive correlation (Spearman correlation (ρ) of 0.33) between summer max temperature and female mortality rates and a corresponding negative correlation (ρ = -0.31) with male mortality rates. A clear change in the direction of the association is noted for males versus females. The influence of heat-related variables on gender differences is further substantiated by the gender-specific models that were fitted (shown in Table 1). Among males, the log rate-ratio estimates for summer max temperature, summer mean temperature, and hot day counts are -0.13 (95% CI = [-0.26, 0.0013]), -0.16 (95% CI = [-0.33, 0.010]), and -0.01 (95% CI =[-0.013, -0.0016]), respectively. When the log rate-ratios are transformed on the percentage relative change in mortality scale through the transformation [math]\left(exp\left(\overbrace{\beta}\right)-1\right)x100[/math] this implies that a one-degree increase in summer max temperature is associated with a 12.09% (95% CI = [-22.81%, +0.13%]) decrease in male mortality counts (shown in Figure 2). An extra hot day contributes to a 0.71% (95% CI = [-1.26%, -0.16%]) decrease in male deaths.
Conversely, the corresponding log rate-ratio estimates exhibit an increased burden of heat on temperature-related mortality rates for females, with point estimates of 0.045 (95% CI = [-0.014, 0.10]) for summer max temperature, 0.066 (95% CI = [-0.010, 0.14]) for summer mean temperature, and 0.0002 (95% CI = [-0.0025, 0.0029]) for heat day counts. Indicating that an increase of one degree in summer max temperature would result in a 4.58% (95% CI = [-1.42%, +10.95%]) increase in female deaths. An additional hot day would also increase the expected female mortality count by 0.02% (95% CI = [-0.25%, +0.29%]). Again, we note reversal of sign and direction of the effects across the two genders. Though most of the association results are not statistically significant, the differences in males and females with the same data sources is intriguing.
Hypothesis testing for equality of log rate-ratio estimates between gender-stratified models further confirms the significance of these gender-specific differences in response to extreme heat conditions. The resulting p-values for summer max temperature, summer mean temperature, and heat day counts are 0.017, 0.018, and 0.019, respectively. All three variables representative of extreme heat conditions have shown statistically significant differences between male and female-specific models. However, cold-temperature-related variables fail to establish significance in the differences between gender-specific coefficient estimates, reinforcing the notion that gender differences are most pronounced in response to heat-related impacts. Results from the model with AR (1) error structure (Supplementary Table S.3) are also consistent with Table 1.
The patterns observed through correlation analyses and data visualisations underline a striking possibility: females exhibit a heightened susceptibility to extreme temperature conditions (specifically heat) compared to males.11 Thus, supporting the growing attention towards factoring in gender in heat-action plans, especially for India.9,11,29
Need for an integrative approach to generate gender-specific climate evidence
The scale and representativeness of data: The coarse resolution of our existing mortality data in India restricted our analytic methods and induced information loss when condensing finer-grained temperature data to fit the annual nationwide scale. To reduce 30 years of time series data to 30 points per gender is losing granularity. Moreover, the aggregation of summer (April to July) and winter (December to February) month temperatures over a year result in the loss of critical information. This summarisation, condensing measurements from hundreds of days into just two observations, oversimplifies the representation of the general hot and cold conditions of a specific year.
We need data that allows monitoring of the continuous daily trends in both mortality and temperature change at varying spatial locations. This deficiency is particularly acute when attempting to study gender-specific responses to abrupt changes in daily temperature, such as those associated with heatwaves or cold spells (see Figure 1a). Consequently, our current data falls short of capturing important factors like seasonal variations, extreme temperature event-specific information, and the identification of potential lag effects in the temperature-mortality relationship.
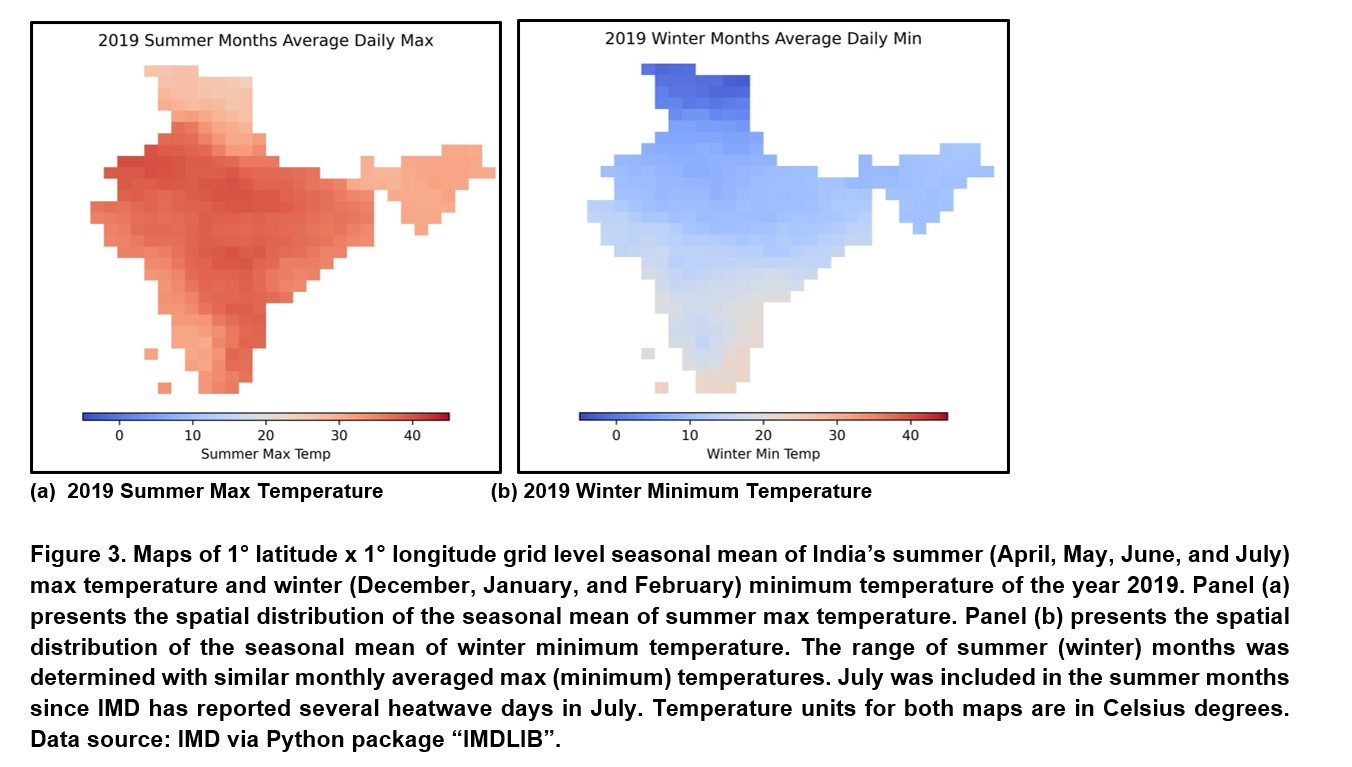
As illustrated in Figure 3, the seasonal-averaged maximum temperatures from April to July (summer) and minimum temperatures from December to February (winter) of the 2019 reveal significant variations among different regions of India. Elevated summer temperatures are predominantly concentrated in the northern and central parts of India, whereas the lowest winter temperatures tend to occur in the northernmost parts of the country. This emphasises the inadequacy of nation-level mortality rates in capturing the distinct regional differences in responses to ambient temperature.
To align with the fine spatial granularity of the daily grid-level temperature data, it is essential to obtain daily gender-specific mortality records at a district/ward level as well as have accurate reporting of extreme temperature related deaths. The need for improved spatial resolution of cause-specific mortality is closely tied to the varied spatial distribution of temperature in India.
Confounding bias: A comprehensive and systematic approach of thinking more in a causal framework, going beyond the crude unadjusted examination of temperature-mortality relationships is imperative, especially when examining gender differences. Demographic and socioeconomic factors such as occupation, household income level, and urbanisation are pivotal in determining an individual’s exposure to extreme temperatures.27 For example, those engaged in outdoor occupations may confront heightened vulnerability to temperature-related threats, while households with lower income levels might struggle to access adequate shelter conditions or healthcare during extreme weather events. The intricate interplay of these factors forms a complex web influencing individuals’ susceptibility to temperature-related impacts. This complexity intensifies when considering gender differences.
What is the intended use of the “gender” variable? Gender, far from being solely a biological construct, is deeply intertwined with societal structures and cultural norms. The impact of traditional gender roles, particularly evident in developing rural or urban poor communities, contributes an additional layer, further deepening gender disparities in vulnerability to environmental challenges. As we strive for a more comprehensive understanding, it is crucial to acknowledge and address these multifaceted factors to develop effective strategies for mitigating the impact of extreme temperatures on vulnerable populations. We need individual-level personal heat exposure data, questionnaire data on lifestyle and behaviours and focus group discussions to understand the relationship between heat and gender, and their joint effect on morbidity and mortality. Our goal is to “prevent” temperature-related mortality, not just to predict it.
Climate conversations for all: A call to action for global data equity
The exploratory study of gender differences in temperature and temperature-related mortality relationships suggests the possibility of distinct vulnerability of Indian females to extreme temperatures compared to males. The predominant influence of heat underscores the need for a targeted understanding of gender-specific responses to environmental threats in India. While our analysis provides valuable preliminary insights into potential gender differences, it is essential to acknowledge the limitations of our current analytic data which prevents us from answering the question we started with: Are women at higher risk of mortality from extreme temperatures in India? We simply cannot answer this based on current data and current analysis.
The insufficient data granularity in both time and space hinders the depth of our analysis, emphasising the need for optimal datasets with adequate resolution that can capture the volatile changes in mortality and extreme temperature conditions. A coarse temporal scale in the mortality data tends to smooth out short-term fluctuations in deaths and captures the long-term trends.
At an annual scale, the available mortality data fails to reflect temperature fluctuations’ immediate effects on mortality, and mortality might just be affected by long-term factors such as advances in healthcare or changes in population demographics. The spatial distribution of monthly averaged daily maximum temperature in India also displays seasonal variation with temperatures ranging from 10 degrees Celsius to 40 degrees Celsius across different locations (shown in Supplementary Figure S.7). The aggregation of temperature data to an annual scale introduces loss of information regarding spatial-temporal differences. Incorporating additional socioeconomic and demographic factors into the analytic framework is also crucial for a more holistic understanding and for formulating targeted interventions to protect vulnerable populations. Existing studies have shown that specific groups such as children31,32, the elderly33,34, and populations of lower socioeconomic status33,35 are most susceptible to extreme temperature threats. The adverse effects in said subgroups are highly prevalent in low- and middle-income countries, underscoring the imperative for further research.
Finally, examining the GBD all-cause mortality data as displayed in Figure 2b raises a fundamental question: if the mortality rates for men are consistently higher historically, why is the census-reported sex ratio in India skewed towards men (106 men per 100 women according to last census)? We looked at birthrate data stratified by gender from GBD and Figure S.8 shows a declining trend in female birthrate. Are these data accurate? Cause-specific mortality data on women may be less accurate or even largely absent in impoverished settlements where the temperature burden is more pronounced. This reiterates the need for setting and enforcing data equity standards. Otherwise, we will always be left with confused climate evidence.
To safeguard vulnerable subgroups from the impacts of extreme temperatures, there is much work to be done. Establishing an optimal database characterised by enhanced resolution and information richness to effectively capture the underlying variabilities of temperature-related mortality can be an important starting point. By refining our analytical tools and broadening the scope of our research, we can pave the way for effective strategies and interventions to mitigate the adverse effects of extreme temperatures, ensuring the wellbeing of all members of society. Data equity is perhaps the strongest advocate and pillar for health equity, climate equity, and more broadly towards societal equity.
References
- Climate change exacerbates violence against women and girls. (n.d.). OHCHR. Retrieved January 25, 2024, from https://www.ohchr.org/en/stories/2022/07/climate-change-exacerbates-violence-against-women-and-girls
- Leisher, C., Temsah, G., Booker, F., Day, M., Samberg, L., Prosnitz, D., Agarwal, B., Matthews, E., Roe, D., Russell, D., Sunderland, T., & Wilkie, D. (2016). Does the gender composition of forest and fishery management groups affect resource governance and conservation outcomes? A systematic map. Environmental Evidence, 5(1), 6. https://doi.org/10.1186/s13750-016-0057-8
- Van Daalen, K., Jung, L., Dhatt, R., & Phelan, A. L. (2020). Climate change and gender-based health disparities. The Lancet Planetary Health, 4(2), e44–e45. https://doi.org/10.1016/S2542-5196(20)30001-2
- United Nations Conference on Trade and Development. (2022). UNCTAD Handbook of Statistics 2022. United Nations. https://doi.org/10.18356/9789210021784
- Mora, C., Dousset, B., Caldwell, I. R., Powell, F. E., Geronimo, R. C., Bielecki, C. R., Counsell, C. W. W., Dietrich, B. S., Johnston, E. T., Louis, L. V., Lucas, M. P., McKenzie, M. M., Shea, A. G., Tseng, H., Giambelluca, T. W., Leon, L. R., Hawkins, E., & Trauernicht, C. (2017). Global risk of deadly heat. Nature Climate Change, 7(7), 501–506. https://doi.org/10.1038/nclimate3322
- Bardhan, R., Sunikka-Blank, M., & Haque, A. N. (2019). Sentiment analysis as tool for gender mainstreaming in slum rehabilitation housing management in Mumbai, India. Habitat International, 92, 102040. https://doi.org/10.1016/j.habitatint.2019.102040
- Chilling Prospects: Tracking Sustainable Cooling for All 2022. (2022, May 17). Sustainable Energy for All | SEforALL. https://www.seforall.org/our-work/research-analysis/chilling-prospects-series/chilling-prospects-2022
- Aik, J., Ang, L., Gunther, S. H., Tang, C., Lee, J. K. W., & Seow, W. J. (2023). Climate change and population health in Singapore: A systematic review. The Lancet Regional Health – Western Pacific, 40, 100947. https://doi.org/10.1016/j.lanwpc.2023.100947
- Debnath, R., Bardhan, R., & Bell, M. L. (2023). Lethal heatwaves are challenging India’s sustainable development. PLOS Climate, 2(4), e0000156. https://doi.org/10.1371/journal.pclm.0000156
- Robinson, A., Lehmann, J., Barriopedro, D., Rahmstorf, S., & Coumou, D. (2021). Increasing heat and rainfall extremes now far outside the historical climate. Npj Climate and Atmospheric Science, 4(1), 45. https://doi.org/10.1038/s41612-021-00202-w
- Bardhan, R., Debnath, R., & Mukherjee, B. (2023). Factor in gender to beat the heat in impoverished settlements. Nature, 620(7975), 727–727. https://doi.org/10.1038/d41586-023-02632-3
- Kumar, R. (2022). Mortality Statistics in India: Current Status and Future Prospects. Indian Journal of Community Medicine: Official Publication of Indian Association of Preventive & Social Medicine, 47(4), 476–478. https://doi.org/10.4103/ijcm.ijcm_614_22
- Kruse, C. S., Goswamy, R., Raval, Y., & Marawi, S. (2016). Challenges and Opportunities of Big Data in Health Care: A Systematic Review. JMIR Medical Informatics, 4(4), e38. https://doi.org/10.2196/medinform.5359
- National Disaster Management Authority, G. of I. (2021). Beating the heat – How India successfully reduced mortality due to heat waves. Government of India. https://ndma.gov.in/sites/default/files/IEC/Booklets/HeatWave%20A5%20BOOK%20Final.pdf
- Death Certificate –. (n.d.). Retrieved February 25, 2024, from https://digitalindiaportals.in/death-certificate/
- Wei, Y., Tiwari, A. S., Li, L., Solanki, B., Sarkar, J., Mavalankar, D., & Schwartz, J. (2021). Assessing mortality risk attributable to high ambient temperatures in Ahmedabad, 1987 to 2017. Environmental Research, 198, 111232. https://doi.org/10.1016/j.envres.2021.111232
- Ingole, V., Kovats, S., Schumann, B., Hajat, S., Rocklöv, J., Juvekar, S., & Armstrong, B. (2017). Socioenvironmental factors associated with heat and cold-related mortality in Vadu HDSS, western India: A population-based case-crossover study. International Journal of Biometeorology, 61(10), 1797–1804. https://doi.org/10.1007/s00484-017-1363-8
- Singh, N., Mhawish, A., Ghosh, S., Banerjee, T., & Mall, R. K. (2019). Attributing mortality from temperature extremes: A time series analysis in Varanasi, India. Science of The Total Environment, 665, 453–464. https://doi.org/10.1016/j.scitotenv.2019.02.074
- Ingole, V., Rocklöv, J., Juvekar, S., & Schumann, B. (2015). Impact of Heat and Cold on Total and Cause-Specific Mortality in Vadu HDSS—A Rural Setting in Western India. International Journal of Environmental Research and Public Health, 12(12), 15298–15308. https://doi.org/10.3390/ijerph121214980
- Sunikka-Blank, M., Bardhan, R., & Mohandas, P. (2023). From informal to formal: Understanding gendered energy transitions through filmmaking in Cape Town and Mumbai. Gender, Place & Culture, 30(12), 1785–1817. https://doi.org/10.1080/0966369X.2022.2115982
- Malik, J., & Bardhan, R. (2023). A localized adaptive comfort model for free-running low-income housing in Mumbai, India. Energy and Buildings, 281, 112756. https://doi.org/10.1016/j.enbuild.2022.112756
- GBD Results | Institute for Health Metrics and Evaluation. (n.d.). Retrieved November 30, 2023, from https://www.healthdata.org/data-tools-practices/interactive-visuals/gbd-results
- Global Burden of Disease Collaborative Network. (2020). Global Burden of Disease Study 2019 (GBD 2019) Population Estimates 1950-2019 [dataset]. Institute for Health Metrics and Evaluation (IHME). https://doi.org/10.6069/7EGY-0354
- Adair, T., Gamage, U. S. H., Mikkelsen, L., & Joshi, R. (2021). Are there sex differences in completeness of death registration and quality of cause of death statistics? Results from a global analysis. BMJ Global Health, 6(10), e006660. https://doi.org/10.1136/bmjgh-2021-006660
- Nandi, S., Patel, P., & Swain, S. (2024). IMDLIB: An open-source library for retrieval, processing and spatiotemporal exploratory assessments of gridded meteorological observation datasets over India. Environmental Modelling & Software, 171, 105869. https://doi.org/10.1016/j.envsoft.2023.105869
- Bhatnagar, M., Mathur, J., & Garg, V. (2018). Determining base temperature for heating and cooling degree-days for India. Journal of Building Engineering, 18, 270–280. https://doi.org/10.1016/j.jobe.2018.03.020
- Li, H., Zhao, Y., Bardhan, R., Chan, P. W., Derome, D., Luo, Z., Ürge-Vorsatz, D., & Carmeliet, J. (2023). Relating three-decade surge in space cooling demand to urban warming. Environmental Research Letters, 18(12), 124033. https://doi.org/10.1088/1748-9326/ad0a56
- Buxbaum, J. D., Chernew, M. E., Fendrick, A. M., & Cutler, D. M. (2020). Contributions Of Public Health, Pharmaceuticals, And Other Medical Care To US Life Expectancy Changes, 1990-2015: Study examines the conditions most responsible for changing US life expectancy and how public health, pharmaceuticals, other medical care, and other factors may have contributed to the changes. Health Affairs, 39(9), 1546–1556. https://doi.org/10.1377/hlthaff.2020.00284
- Pillai, A. V., & Dalal, T. (n.d.). How Is India Adapting to Heatwaves?: An Assessment of Heat Action Plans With Insights for Transformative Climate Action. CPR. Retrieved February 25, 2024, from https://cprindia.org/briefsreports/how-is-india-adapting-to-heatwaves-an-assessment-of-heat-action-plans-with-insights-for-transformative-climate-action/
- Li, A., Toll, M., & Bentley, R. (2023). Mapping social vulnerability indicators to understand the health impacts of climate change: A scoping review. The Lancet Planetary Health, 7(11), e925–e937. https://doi.org/10.1016/S2542-5196(23)00216-4
- Banerjee, R., & Maharaj, R. (2020). Heat, infant mortality, and adaptation: Evidence from India. Journal of Development Economics, 143, 102378. https://doi.org/10.1016/j.jdeveco.2019.102378
- Xu, Z., Etzel, R. A., Su, H., Huang, C., Guo, Y., & Tong, S. (2012). Impact of ambient temperature on children’s health: A systematic review. Environmental Research, 117, 120–131. https://doi.org/10.1016/j.envres.2012.07.002
- Benmarhnia, T., Deguen, S., Kaufman, J. S., & Smargiassi, A. (2015). Review Article: Vulnerability to Heat-related Mortality. Epidemiology, 26(6), 781–793. https://doi.org/10.1097/EDE.0000000000000375
- Schifano, P., Cappai, G., De Sario, M., Michelozzi, P., Marino, C., Bargagli, A. M., & Perucci, C. A. (2009). Susceptibility to heat wave-related mortality: A follow-up study of a cohort of elderly in Rome. Environmental Health, 8(1), 50. https://doi.org/10.1186/1476-069X-8-50
- Burkart, K., Khan, Md. M. H., Schneider, A., Breitner, S., Langner, M., Krämer, A., & Endlicher, W. (2014). The effects of season and meteorology on human mortality in tropical climates: A systematic review. Transactions of The Royal Society of Tropical Medicine and Hygiene, 108(7), 393–401. https://doi.org/10.1093/trstmh/tru055
| Analytic Data ● Mortality Data. Encompassing the gender-specific population estimates, environmental heat and cold exposure mortality, and all-cause mortality counts and rates of India. All mortality data are from the GBD Results. According to the GBD Results codebook, mortality rates are defined as deaths per 100,000 people. All mortality data are on the annual nationwide scale. ● Temperature Data. India Meteorological Department (IMD) recorded air temperature measurements can be downloaded by the Python package “IMDLIB”. Grid-level daily mean, max, and minimum temperatures are available for the entirety of India. We further calculate the following variables from the grid-level data: ○ Summer max temperature: Annual averaged daily max temperature of April to July. ○ Summer mean temperature: Annual averaged daily mean temperature of April to July. ○ Winter minimum temperature: Annual averaged daily minimum temperature of December, January, and February. ○ Winter mean temperature: Annual averaged daily mean temperature of December, January, and February. ○ Heat day counts: Annual counts of heat days, defined as days with max temperatures equal to or exceeding the 90th quantile (36.103°C) of historical daily max temperature data from 1990 to 2019. ○ Cold day counts: Annual counts of cold days, defined as days with minimum temperatures equal to or below the 10th quantile (11.261°C) of historical daily minimum temperature data from 1990 to 2019. |
______________________________________________________________________________________________________
Yi-Ting Lin is a Ph.D. student of the Department of Biostatistics at the University of Michigan.
Dr Ronita Bardhan is associate professor of sustainable built environment at University of Cambridge. She works on built environment-led health inequalities in the warming climate.
Dr Ramit Debnath is an assistant professor and director of the Cambridge Collective Intelligence & Design Group at the University of Cambridge. He is a fellow of the Royal Statistical Society.
Dr Bhramar Mukherjee (corresponding author) is John Kalbfleisch Distinguished University Professor and Chair of Biostatistics, and Siobán Harlow Collegiate Professor of Public Health at the University of Michigan. bhramar@umich.edu
You might also like: Is Rome becoming the ‘Infernal City’?


