
 |
| A pro-natalist poster from the Soviet era (source). The text can be translated as (top) "Children – happiness of the family, Children – future of the society" and (bottom) "Be happy, darling!". |
The result was economic recession, emigration, unemployment, the end of social support and the deteriorating confidence of the population – all of which led to huge and rapid demographic changes. For instance, life expectancy in Russia decreased by at least 6.2 years for men and by 3.4 years for women between 1990 and 1994.1
Over the past quarter of a century, most demographic and health indicators in these countries have bounced back, and are now at levels similar to or higher than what they were during the communist era.2 However, this has not been the case with birth rates; in particular, we are interested in looking at the demographic decline in terms of changes in the live births frequencies in the CEE countries.
To investigate this, we collected monthly frequencies of live births occurring in the CEE countries from the United Nations and Eurostat datasets as well as the datasets provided by the National Statistics Offices of each country.3 Monthly rates were standardised to 30-day months and the datasets were compared to check consistency of the data. In most cases the datasets closely agreed and hence we combined them in order to get the longest possible series.
Figure 1 shows how live birth patterns developed from 1960 to 2014 expressed as rates of annual live births to population. It can be observed that even after adjusting for the changes in population, all the CEE countries experienced a severe decline in live birth rates. USSR member states went into a decline phase about a decade later that other CEE countries – in the mid-1980s as opposed to the mid-1970s. Most countries reached a trough around the year 2000 before starting to recover; in particular, live births in the former USSR states were growing more consistently and at higher rates than other countries in the region.
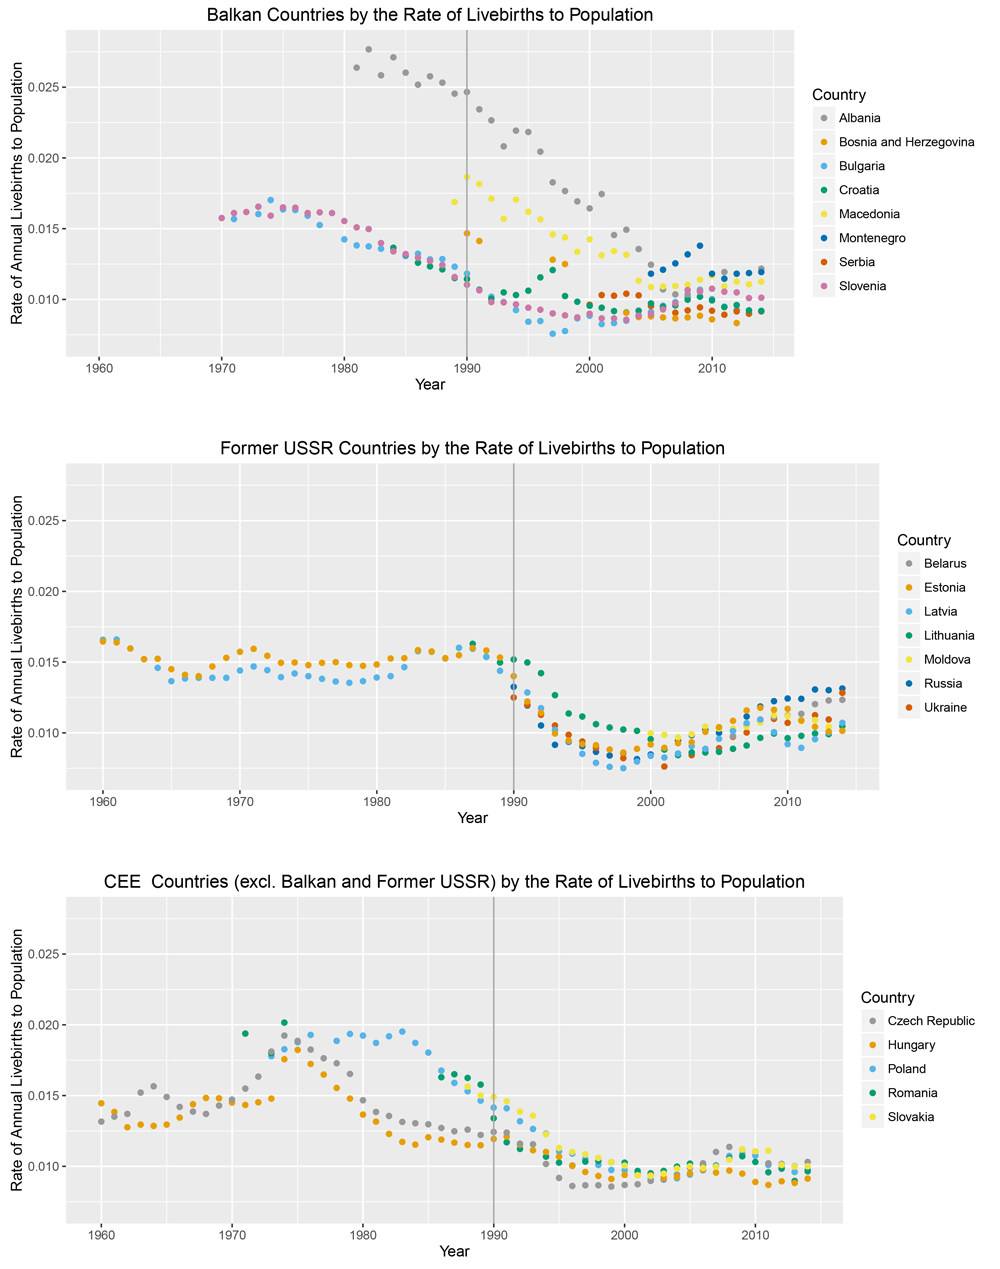
Figure 1. CEE countries by the rate of annual live births to total population, from 1960 to 2014. Top: Balkan countries. Middle: former USSR countries. Bottom: remaining CEE countries, excluding Balkans and former USSR. No data available where blank. Vertical line added in 1990 to indicate time of transition and collapse of communist regimes
The data were modelled using a 5-parameter asymmetric logistic model, which is commonly used in pharmacokinetics to describe changes in a biomarker as a function of drug concentration or time: from a stable state corresponding to an infection, for example, there’s a relatively rapid decrease in the biomarker values until they again reach a stable, normal state. This physiological process is analogous to one of demographic decay.
Our model fitted ratios of annual number of live births to maximum annual number of live birth for each country as the model required the response variable to be between 0 and 1. The model’s parameters are: lower and upper asymptotes, the inflexion year (in this case, the year in which the live births were halfway between the asymptotes), slope (the rate of change of the response), and an asymmetry parameter governing the shape of the decay. Examples of fits for Albania and Poland are shown in Figure 2.

Figure 2. Observed and fitted values with 95% confidence intervals of the ratios of births to annual country maximum fitted using 5-parameter asymmetric logistic model. Inflexion points shown as large blue circle
Estimated model parameters are presented in Table 1. Unfortunately, for half of the countries the datasets available began during the post-communist periods when live births were already in decline, hence the model could not estimate sensible parameters and these countries were omitted. These included Russia, the biggest country of the USSR.
Figure 3 plots the magnitude of decline versus slope for each country.
Table 1. Estimated bottom and top asymptotes, slope, inflexion year, and first and last year of decline for the annual rate of births fitted with 5-parameter asymmetric logistic model. Countries split into Balkans, former USSR, and other CEE. Sorted by the estimated first year of decline

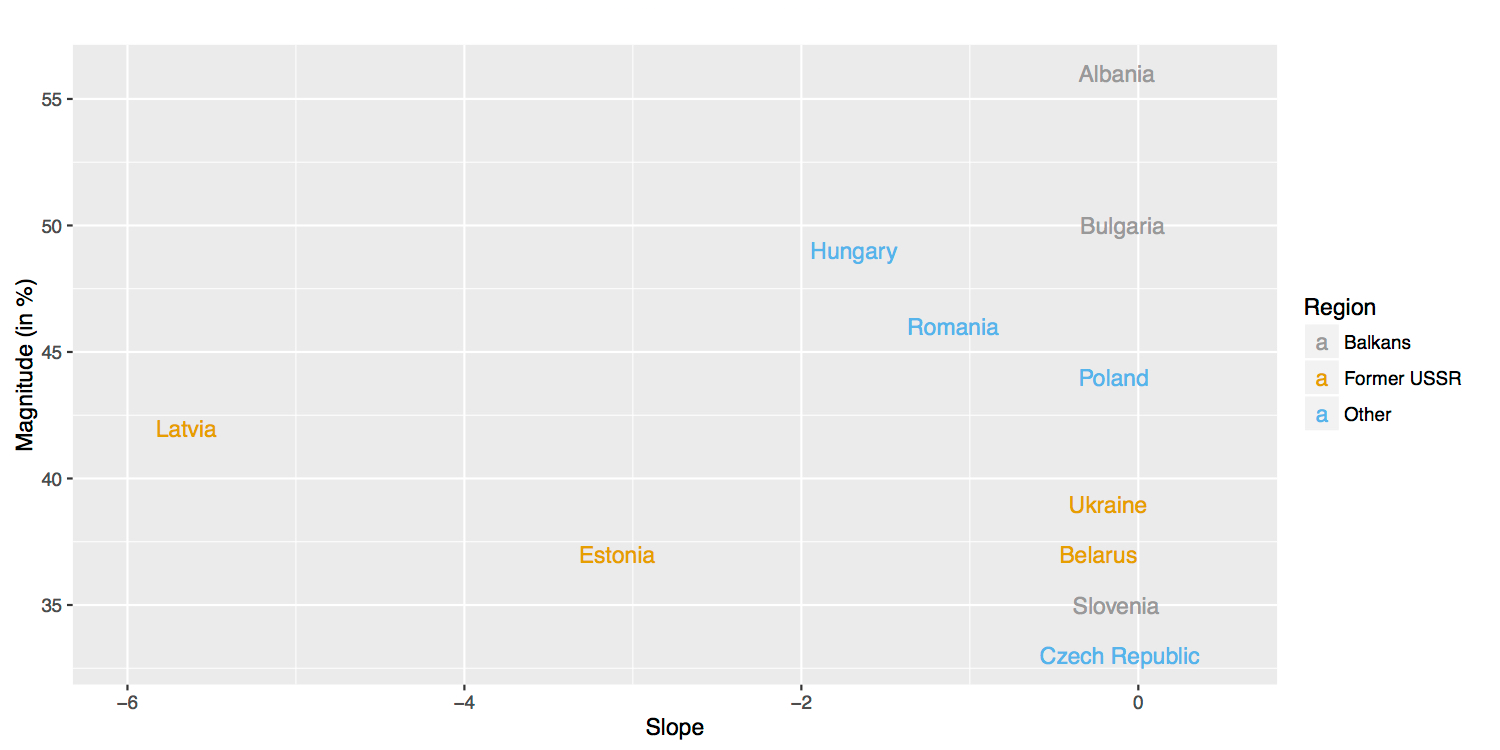
Figure 3. Magnitude of the fall (difference between top and bottom asymptotes over top asymptote) versus slope of the fall, estimated by 5-parameter asymmetric logistic model (countries with improper estimates omitted)
Results
All CEE countries for which there was data pre-1990 experienced a peak in the live birth counts in the mid-1970s or mid-1980s followed by a steep decline. In most countries the trough occurred around 2000. Such significant changes in the birth patterns suggest two possible reasons: higher rates of migration of women of reproductive age and people deciding to have less children. The trends of live birth rates adjusted by size of the population shown in Figure 1 support the second argument as even adjusted rates followed the declining trend. Unfortunately we had no access to yearly numbers of women in reproductive ages thus we could only obtain rates based on total population sizes.
The fall in live births started in the late 1980s in the former USSR countries and in the mid to late-1970s in other CEE countries. Following the collapse of the Soviet Union the new governments and systems took some time to be established. In the Soviet era, the state followed a pro-natalist policy, which encouraged people to have more children both by promoting traditional family values and by offering extensive financial support to parents.4 When the system collapsed, countries went into economic recession and the governments at first could not provide any social benefits. Hence, going on maternity or paternity leave would mean a loss of a significant part of the family income that was relatively low anyway. The rest of the CEE countries experienced the collapse of communism approximately at the same time as the Soviet countries (late 1980s – early 1990s) but their decline in live births had started about a decade earlier.
The parameters of the asymmetric logistic model give some indication of the patterns of the fall in live births in some countries (see Table 1). We can conclude that Albania went into a decline phase about a decade later than Bulgaria and Slovenia. Figure 3 shows that the three Balkan countries had similar and relatively low slopes of decline but the magnitudes differed. Albania underwent the deepest fall, its live birth rates declining by 56% in 19 years. In Bulgaria, the fall was slightly smaller (around 50%) and it lasted for 20 years. Slovenia experienced the smallest and shortest fall among the Balkan countries with live birth counts falling by approximately 35% in 15 years.
The patterns of decline in Belarus and Ukraine were quite similar: starting in 1984 and 1985, with an inflexion year in 1992 and last year of decline in 1995 and 1996, respectively. The magnitudes and slopes of their falls were also similar (below 40%), with Ukraine falling slightly deeper than Belarus. Similarly, Estonia and Latvia followed each other quite closely with falls starting in 1990 and 1991 and ending in 1995 and 1996, respectively. It is worth noting that Estonia and Latvia fell extremely steeply, with estimated slopes of -3.1 and -5.6 and the falls lasting for just five years. The magnitudes of decline in Estonia and Latvia were close to 35% and 40%, respectively. The fall in Hungary started in 1978 and births went down steeply, by almost 50%. Next, the Czech Republic and Poland stared to decline in 1981 and 1982, respectively.
The slopes of their curves were quite low – for instance, the magnitude of the fall in Poland was estimated at around 45% and the Czech Republic experienced the smallest decrease (around 35%) among the CEE countries for which such parameters were estimated. The first year of decline in Romania was estimated to be 1987 but there was a gap in the data in the late-1970s to early-1980s and we suspect that the fall actually started earlier, in line with other non-USSR CEE countries. The fall in Romania was steeper than in Poland and the Czech Republic but not as steep as in Hungary, with live births falling by around 45%.
The live birth trends in Russia, by far the biggest CEE country, are of special interest. Unfortunately we could not obtain detailed data on live birth counts from the communist period. However, they were falling significantly until 2000 and then started to grow, almost reaching the level of 1990.
Discussion
Combined with increasing life expectancy and emigration of young people, lower fertility rates have important implications – ageing populations are forced to depend on a reduced young workforce. According to Hoff (2008), since 1990 CEE countries have experienced more rapid ageing in their populations than countries in Western Europe.5 The latter are ageing too, but Western countries became affluent before turning into ageing societies, in contrast to those of CEE. This resulted in strong pressure on social systems to provide pensions, health care and other services for elderly. Hoff also projects a continuous rise of ageing populations in both Western and Central and Eastern Europe. The socioeconomic impacts of this process and the post-communist decline in births will therefore remain on the political agenda of these countries for many years to come.
- Jekaterina Kremneva was awarded an MSc in Statistics at University College London in 2016. This article is based on her MSc thesis.
- Angie Wade is professor of medical statistics at the UCL Institute of Child Health.
- Mario Cortina Borja is chairman of the Significance editorial board, and professor of biostatistics in the Population Policy and Practice Programme, Institute of Child Health, University College London.
References
- Leon, DA; Chenet L; Shkolnikov VM; Zakharov S; Shapiro J; Rakhmanova G; Vassin S; McKee M (1997) Huge variation in Russian mortality rates 1984–94: artefact, alcohol, or what? The Lancet 350, 383-388. http://www.sciencedirect.com/science/article/pii/S0140673600042124 ^
- Rechel B; Roberts B; Richardson E; Shishkin S; Shkolnikov VM; Leon DA; Bobak M; Karanikalos M; McKee M (2013) Health and health systems in the Commonwealth of Independent States. The Lancet 381 1145-1155 http://www.thelancet.com/pdfs/journals/lancet/PIIS0140-6736(12)62084-4.pdf ^
- Kremneva J (2016) Modelling live birth distributions in Central and Eastern Europe. MSc in Statistics Thesis. Department of Statistical Science, University College London. ^
- Hoffman DL (2000) Mothers in the motherland: Stalinist pronatalism in its pan-European context. Journal of Social History 34, 35–54. ^
- Hoff A (2008) Population ageing in Central and Eastern Europe as an outcome of the socio-economic transition to capitalism. Socialinis Darbas 7, 14-25 https://www.mruni.eu/upload/iblock/adc/2_hoff.pdf ^


