
Four years ago, Russia hosted the Sochi Winter Olympics. Today, as the 2018 Games get underway in PyeongChang, South Korea, Russia will be absent. The country’s Olympic Committee was suspended by the International Olympic Committee (IOC) in December, following accusations of the use of performance-enhancing drugs (PEDs) among Russian athletes and further claims that Russia has engaged in the state-sponsored cover-up of doping offences.
(In fairness, Russian athletes who could prove they were clean could still compete, but only as individuals under a neutral flag.)
Over nearly 50 years of Olympic anti-doping activity, Russia (and its predecessors, the Soviet Union and the Unified Team) has been stripped of 43 medals – that’s almost one-third of the 139 medals stripped from all nations combined. No other country comes close to matching this record of shame. In the list of medals stripped by country, Belarus (11), Ukraine (10), Kazakhstan (9) and the United States (8) hold positions two through five; added together, their stripped medal counts are still less than that of Russia.
Russia’s stripped medal count has more than doubled from 20 to 43 in the past year thanks to the concerted efforts of anti-doping investigators at the World Anti-Doping Agency (WADA), an arm of the IOC. Russia was even stripped of 13 medals won at Sochi in 2014, as of 22 January 2018, but the Court of Arbitration for Sport restored nine of those medals on 1 February 2018.
The Olympic war on drugs
Anti-doping is a relatively new activity in the long and storied history of the Games. At the Ancient Olympics, bribery was illegal, but athletes openly took hallucinogens, opium juice and strychnine – the stimulant of choice among chariot drivers.1 As late as 1904, Thomas Hicks won the marathon while taking strychnine, apparently believing that which did not kill him would make him stronger (though his family nearly had to collect his gold medal posthumously, as he had to be supported and carried across the finish line). During the 1912 modern pentathlon competition, erstwhile US Army officer George Patton (later to be a famous general of the Second World War) took an injection of opium before the running competition; he went on to produce his best result. Ironically for a military man, he would have medaled had his shooting scores not been so low.
In 1968, the first doping violation was self-identified when a modern pentathlete was so drunk his wobbly gunmanship required that he be tackled and subdued. Early anti-doping testing and subsequent disqualification continued in 1972 when narcotic analgesics and stimulants were first tested. Anabolic steroids joined the banned list in 1975. The anti-doping effort ramped up dramatically to include both in-competition and out-of-competition testing after 1988, the year when Ben Johnson of Canada got the IOC’s attention, and that of the rest of the sports world, when he was stripped of his 100m world record and Olympic medal due to PED use. The Canadian Court system joined the action when the Dubin Inquiry ruled that there was rampant use of PEDs in Olympic sports and that detection methods were grossly inadequate, which lead to immediate changes. A much more sensitive anti-doping system was then introduced in 2009: the Athlete Biological Passport. Samples were taken at regular intervals from all athletes and stored. At any time, samples could be compared, not so much for PEDs themselves, but for having certain changes as markers that PEDs had been taken.
1988: a watershed moment
Athletics is arguably the highest-profile sport in the Olympic line-up, and since it has the greatest number of medals available of all Olympic sports, it has provided ample temptation to cheaters to take PEDs and gain financial reward.
The year 1988 became a watershed moment for athletics. To see why, consider Figure 1. This plots the history of the rate of improvement in athletics over the entire span of the modern Olympic Games, from 1896 to 2016. Each bar shows the percentage improvement per Olympiad (%I/O), based on the 763 male and female winners in athletics events, excluding the variable-terrain marathon and walking events. %I/O is the percent by which a winning time was less, or a winning height or distance more, than that of the Olympic champion four years earlier. The values of %I/O were then averaged for each of the Games of the modern era (women joined athletics competition in 1928).
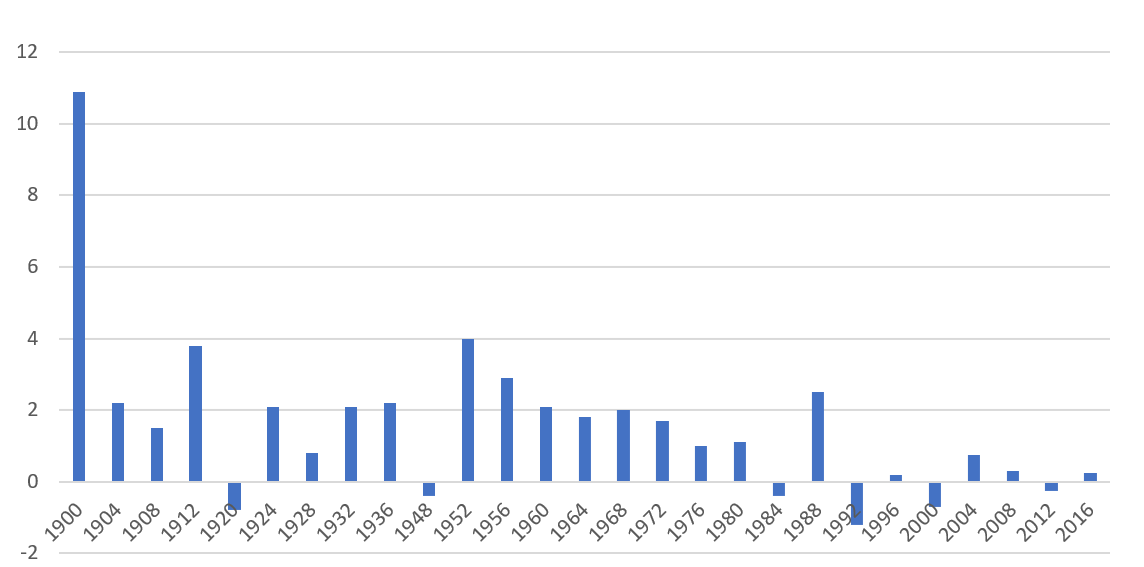
FIGURE 1 Average percent improvement per Olympiad (%I/O) in athletics events, excluding the variable-terrain marathon and walking events, 1896-2016.
1988 marks a transition point, from a period of general and sustained performance improvement from one Olympic Games to another, to a period of modest fluctuating gains and losses. One may speculate that this change in the pattern of performance improvement is in some way linked to tougher anti-doping rules.
Previously, I have derived the kinesiology and physics of the various athletics events2 and have used those equations to place the winning performances of each Olympics into perspective.1, 3-9 Drawing from that knowledge, I briefly explain the basics of performance and how PEDs aid performance. I then explain what Figure 1 has to tell us about post-1988 performance under anti-doping activity.
For athletes, there are two ways to improve performance: there’s the honest way, which involves using what kinesiology has to teach, and there is the dishonest way, using PEDs. Any athlete can measure their power output on a treadmill, for example. That power depends on lean (non-fat) body mass, training and nutrition. The honest athlete trains to gain power output as effectively and as hard as possible. Good nutrition is used to build and maintain lean body mass and to help heal injuries. For the cheater, anabolic steroids provide effective anti-inflammatory action which can support a significant increase in the duration and intensity of training; they also aid in the healing and increase of lean body mass. Other PEDs increase red blood-cell count and enhance oxygen transfer to aid aerobic power.
Of course, generating power by running on a treadmill, or just running wind sprints, does not push a runner across the finish line first. That power has to be used efficiently, depending on the demands of each event. Efficiency depends on coaching, equipment and technique. Smarts, not PEDs, are needed. Athletes and coaches have gained a wide range of video- and computer-based aids and manufacturers have developed equipment that has helped efficiency to improve over the years. For example, in athletics we have seen breakthroughs such as the fibre-glass pole in the pole vault and the Fosbury Flop technique in the high jump.
Now it is time to learn what Figure 1 has to teach us about pre-1988 winners so we can put that to use to understand post-1988 winners. If we look at the chart in detail, the never-repeated 11% average %I/O in 1900 coincided with the metamorphosis of the Olympic Games from an invitational track meet in 1896 to a world-wide phenomenon in 1900. %I/O increased for the Games of 1904 to 1912, coincident with nationalistic fervor leading to the First World War, which incentivised a number of nations to identify young potential athletes, train them and support them through Olympic competition as a bellwether of national importance. The negative improvement in 1920 coincided with lack of sports training and competition during World War I, followed by a predictable rebound in 1924 (the Games that became the subject of the film Chariots of Fire), when athletes had been able to train properly and when winners were compared to the poor performances of 1920. History repeated itself with a pre-WWII buildup visible for the 1928-36 Games, post-war negative improvement in 1948 and the rebound of 1952.
The Cold War era (and massive spending on sports as an East-West test of dominance) was coincident with consistently high percentage improvements for the Games of 1956-88, with one exception. There were boycotts in 1980 by Western nations and in 1984 by Eastern nations. The top medal-winning nation in athletics at that time was the Soviet Union, followed by East Germany and the USA. Because the top two medal winners were in Moscow in 1980, improvement continued. But their absence from the 1984 Games predictably resulted in negative improvement, followed by a rebound in the fully-attended Games of 1988 where winners were compared to diminished 1984 standards. The %I/O values for the 1956-88 games had flattened out (as the Cold War toned down) to about 1%, which was the value for 1976, for 1980, and the average combining 1984 with 1988.
Earlier, I explained how PEDs increase power output compared to the honest athlete. Meanwhile, improvements in efficiency are always being sought. Post-1988, the fact that performances declined and later rebounded fits the hypothesis of reduced PED use followed by accumulated improvements in efficiency and training resulting in a “new normal”. There were no world wars and no boycotts. As the Soviet Union broke up, constituent republics still could compete. East German athletes were absorbed into a single German team. And, of course, anti-doping efforts ramped up.
From 1988 to 2008: %I/O was generally worse for 1992 (-1.2%), 1996 (0.2%) and 2000 (-0.7%), -1.7% in total, followed by improvements in 2004 (0.75%) and 2008 (0.3%), a total of 1.05% for an average 0.5% as the “new normal”, half the 1% average %I/O for the last four Olympiads pre-1988. The average 2008 winner was 0.66% worse than in 1988.
After being introduced in 2009, the sensitivity of the Athlete Biological Passport would catch many cheaters who would have not been caught before. The pattern of 1988 to 2008 was repeated. Winning performances were worse in 2012 (-0.26%) followed by an improvement (0.25%) under a “new-new normal”. That new-new normal value of 0.25% for %I/O is again half of the new normal value of 0.5% which emerged in 1988-2008, and a quarter of the 1% leading up to 1988. The average 2016 winner was 0.67% worse than in 1988 – a small price to pay for cleaner competition.
About the author
Ray Stefani is an emeritus professor with the California State University, Long Beach, USA.
References
- Stefani, R.T. (2017) What Performance Data Tells Us about PEDs in Olympic Athletics and Swimming. Proceedings, Mathsport International, Mathsport 2017, Padua, Italy 26 – 28 June 2017. ^^
- Stefani, R.T. (2014) Power-to weight relationships and efficiency improvements of Olympic champions in athletics, swimming and rowing. International Journal of Sports Science and Coaching, 9(2), 271-285. ^
- Stefani, R.T. (1989) Olympic Winning Performances: Trends and Predictions (1952-1992). Olympic Review, No. 258, April 1989, pp. 157-161; No. 259, May 1989, pp. 211-215. ^
- Stefani, R.T. (1994) Athletics, Swimming and Weightlifting from Barcelona to Atlanta. Olympic Review, No. 326, pp 598-603, December, 1994. ^
- Stefani, R.T. (2000) Olympic Winning Performances: No Longer Citius, Altius, Fortius. Chance, Spring 2000, vol. 13, no. 2, pp 15-19. ^
- Stefani, R.T. (2007) The Physics and Evolution of Olympic Winning Performances. Chapter 3, Statistical Thinking in Sports, Chapman and Hall/CRC Press, July 12, 2007. ^
- Stefani, R.T. (2012) Overcoming the doping legacy: Can London’s winners outperform the drugs of 1988? Significance, 9(2), April 2012, pp 4-8. ^
- Stefani, R.T. (2013) The London Olympics in Perspective: Athletics, Swimming and Home Nation Medal Advantage. Proceedings, Mathsport International, Mathsport 2013, Leuven Belgium,5-7 June, 2013. ^
- Stefani, R.T. (2014) Understanding the Velocity Ratio of Male and Female Olympic Champions in Running, Speed Skating, Rowing and Swimming. Proceedings of the 12th Australasian Conference on Mathematics and Computers in Sport, Darwin Australia, 25-27 June, 2014. P106. ^


