
The UK government provides an update during their daily briefing of the number of people that have died in hospital after testing positive for Covid-19. But what do these numbers really mean?
In this article, “announced deaths” is similar to the number of hospital deaths announced during the daily briefing (the number at the briefing is deaths throughout the UK, but this article discusses deaths in England specifically), and “recorded deaths” refers to the number of those deaths that occurred on a particular date. For NHS England, a day’s announced deaths are those reported by hospitals in a 24-hour time window, up to 5pm the day before the announcement date. Whilst we may think the daily announced deaths refer to the number of people that died during the previous day, it is more complicated than that, as discussed in the article “Covid-19 data: To age or not to age; to date or not to date?“.
In that previous article, it was shown that for deaths in English hospitals announced between 26 March and 1 April, the percentage of announced deaths that referred to deaths that occurred the day before the announcement ranged between 11% and 23%. Expanding this analysis using data from the NHS in England for deaths announced between 2 and 23 April, we see a similar range of proportions, with at most 24% of announced deaths occurring on the previous day. In other words, less than a quarter of any day’s “announced deaths” were deaths that occurred the day before. This means that the majority (at least 76%) of “announced deaths” on any particular day occurred more than 24 hours beforehand. The difference between the date of death and the date of announcement can be several days, or even weeks, as shown in Figure 1, as some deaths announced in April occurred in early March.
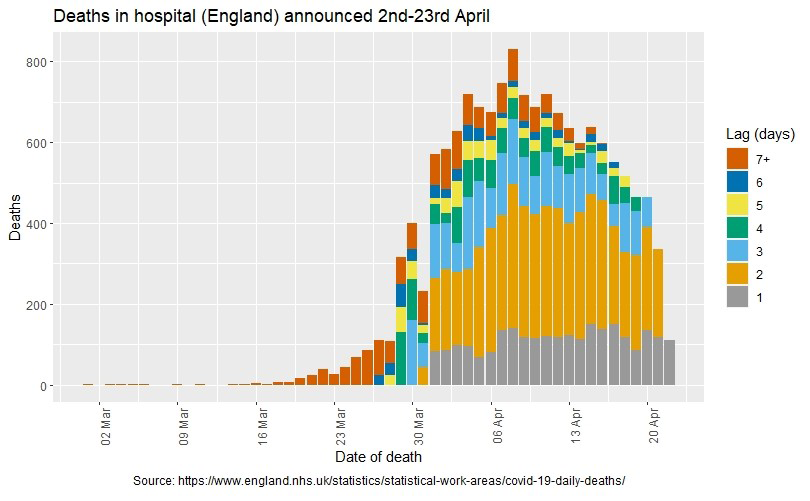
FiGURE 1 Date of death and announcing lag of deaths in English hospitals, for deaths announced between 2 and 23 April.
Figure 1 orders deaths by the actual date of death rather than the date the deaths were announced. This means that the numbers decrease steeply in more recent days, because of the delay in deaths being recorded and announced, rather than because of fewer fatalities. Red segments in this plot indicate deaths that have been announced a week or more after the date of death. Note that the announcements used to generate this plot start from 2 April; therefore March entries in Figure 1 only feature deaths that were not announced until April.
Through monitoring the pandemic, we know that there is a time delay between infection and symptoms, symptoms and hospitalisation, and between hospitalisation and death. Studies of Covid-19 patients in China found that the median incubation period was 5 days,1 and deaths occurred a median of 16 days after symptoms began.2 The additional lag between a death occurring and it being reported adds another layer of delay: between deaths being recorded and deaths being announced. In England this delay adds a median of two days. However, for 11% of hospital deaths, this delay is a week or more.
To show this extra layer of lag, the announced deaths for each day are overlaid onto the previous plot to give Figure 2. The highest point in the announced deaths (shown as a line in the plot) is two days after the highest point in the recorded deaths (bars in the plot), but there is no consistent delay between the announced and recorded levels of deaths. Announced deaths fluctuate from day to day, and one pattern that can be seen in Figure 2 is that announcements made following weekend days (squares) are generally the lowest values in the week.
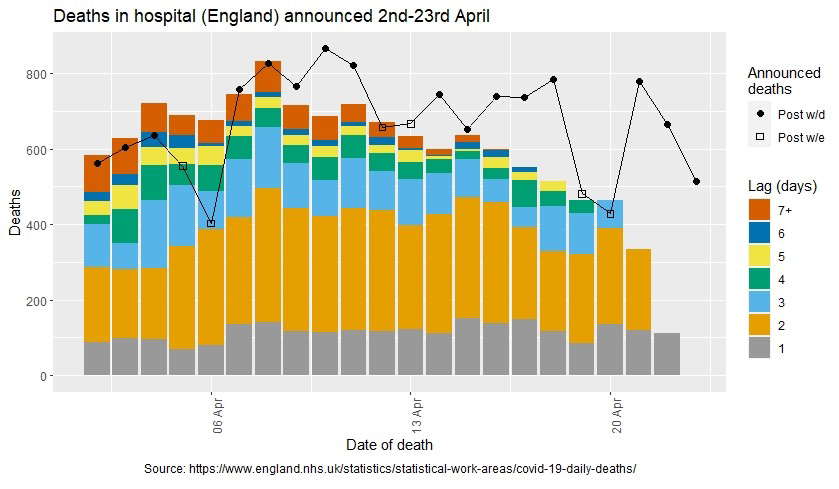
FIGURE 2 Date of death and announcing lag of deaths in English hospitals, with number of deaths announced on that day (line). Post w/d are Tuesdays to Saturdays, post w/e are Sundays and Mondays.
What happens during the weekend?
As the deaths announced on a particular day are those reported before 5pm the previous day, the “weekend effect” is actually seen on Sundays and Mondays. One obvious reason for this effect would be that fewer of the 223 NHS trusts in England are reporting on weekend days due to lower levels of administrative staff, or delays in test processing. A decrease in the number of trusts reporting over the weekend is evident in the NHS England data: for example, Sunday 19 and Monday 20 April had announcements from 118 and 108 trusts respectively, down from 135 trusts in the Saturday 18 April announcement.
However, the difference in the number of reporting trusts is not the only change that occurs at the weekend. On Sundays and Mondays, fewer deaths are announced with a date of death more than a few days old. Figure 3 shows this: blue bars (lag of three or more days) are smaller on days after the weekend compared to other days of the same week. This reduction in the reporting of deaths that are more than a few days old, plus fewer trusts reporting, both lead to a dip in the announced deaths on Sundays and Mondays.
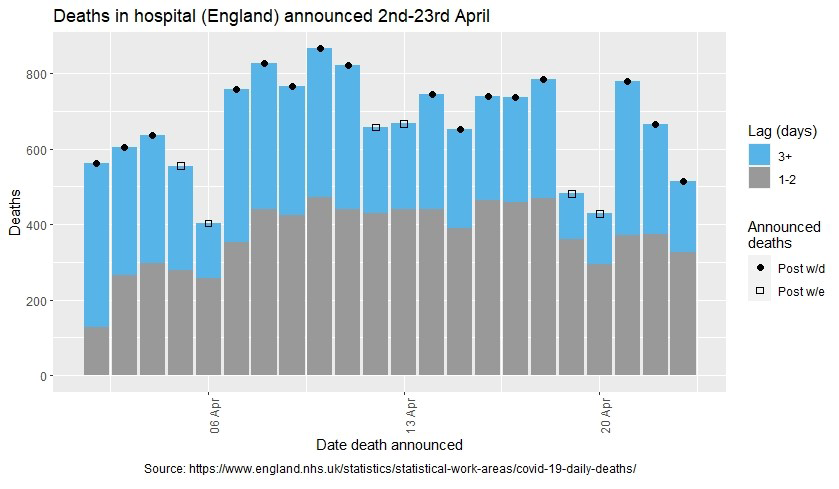
FIGURE 3 Daily deaths and announcing lag of deaths in English hospitals. Post w/d are Tuesdays to Saturdays, post w/e are Sundays and Mondays.
Can we compare daily deaths weekday-to-weekday?
Because of the “weekend effect”, deaths announced on weekends and weekdays cannot be directly compared. But can we compare the weekday announcements?
Daily announced deaths are the sum of deaths reported by hospital trusts, and the number of trusts reporting on each day varies. In addition, these hospital trusts can be of very different sizes. Even having the same number of trusts but a different combination of them reporting each day would not make a day-to-day comparison straight forward, as days when larger trusts report will naturally see higher totals.
Another reason for variability in the announced deaths is that individual trusts may report deaths that were recorded on several days within one announcement, and this can be seen particularly in deaths that have taken longer to announce. For example, on one day in April, a single trust accounted for 16% of the total announced figure. Counting only deaths that occurred a week or more before, a different trust accounted for 10% of the total announced deaths on 21 April.
The bottom line is, “deaths reported in a 24-hour period” is not the same as “the number of people that have died in a day”. Reporting delays, and changes in the composition of trusts that report each day, make the daily values hard to compare. Daily death totals vary from day to day for many reasons that are not due to differences in the actual number of people dying with Covid-19 in English hospitals. Whilst numbers dropping swiftly for a couple of days in a row may bring hope, it is important to look at the longer-term behaviour to understand the true picture.
About the author
Kathryn Leeming is a research fellow based at the University of Warwick. Her current research includes investigating methods for time series analysis and signal processing at scale, as part of the CoSInES programme.
References
- Lauer, S. A., Grantz, K. H., Bi, Q., et. al. (2020) The Incubation Period of Coronavirus Disease 2019 (COVID-19) From Publicly Reported Confirmed Cases: Estimation and Application. Annals of Internal Medicine, 172, 577–582. ^
- Chen, T., Wu, D., Chen, H., Yan, W., Yang, D., Chen, G., et. al. (2020) Clinical characteristics of 113 deceased patients with coronavirus disease 2019: retrospective study. British Medical Journal, 368, m1091. ^


