
I listened to David Cannadine on Radio 4 a few weeks ago telling the story of the ninth President of the United States, William Henry Harrison (1773-1841). Harrison holds the record for the longest inaugural address, at nearly two hours, and also the record for the shortest presidency, dying after only 30 days in office due to pneumonia.
The story is that Harrison contracted pneumonia because he refused to wear either a hat or a coat while giving his inaugural address. It is difficult to know whether this story is entirely true. In a large number of cases, pneumonia is a consequence of other chronic illnesses which increase vulnerability to the cold, rather than the true cause of death.
This is particularly the case among older people. The selection of a cause of death from the conditions listed on a death certificate follows a set of internationally agreed rules of which changes in rule 3 have had the largest impact on how the cause of death is selected. In the current Tenth Revision of the International Classification of Diseases (ICD-10), introduced in 2001, rule 3 states that when more than one condition is given on the death certificate the cause of death should be the condition which initiated the final illness, unless the condition which initiated the final illness is a direct consequence of another reported condition, in which case this condition should be selected.
Rule 3 is used in cases where the final illness comes from a list of conditions which includes pneumonia but also conditions such as cardiac arrest and heart failure (see this article from the Lung and Asthma Information Agency for more details). In ICD-9, rule 3 stated that where there was a major condition other than the final illness on the death certificate, the major condition was selected whether or not it initiated the causal sequence leading to death. The list of conditions where rule 3 is implemented was also broadened in ICD-10 in comparison to ICD-9. The changes to rule 3 may seem small but an ONS study found that the impact was to significantly reduce the number of deaths assigned to conditions such as pneumonia while increasing the number of deaths assigned to chronic conditions, such as stroke and Alzheimer’s disease.
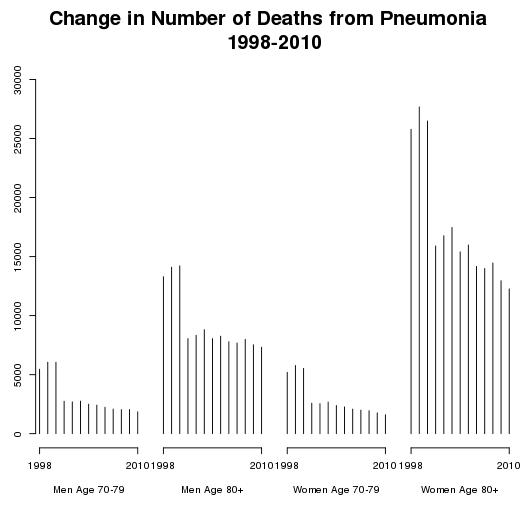
The figure below shows the number of deaths in England and Wales from pneumonia between 1998 and 2010 by age group (70-79 years and 80 years and over) and separately for men and women. The figure shows the significant drop in the number of deaths from pneumonia which took place when ICD-10 was introduced in 2001. Between 2000 and 2001 the number of deaths due to pneumonia declined by over 40 percent for both men and women aged over 80 years. The changes in the rules used to select a cause of death may provide a better description of what people die from, but for researchers interested in studying changes in patterns of mortality over time they represent a real difficulty.
Although the number of deaths from pneumonia declined with the introduction of ICD-10, pneumonia remains an important cause of excess winter mortality in England and Wales. The figure below shows the variation in the number of deaths in each week in England and Wales from August 1999 to July 2012 using data from the annual ONS publication on winter deaths.
The number of weekly deaths show a clear rise in the winter months with particularly high numbers of deaths in 1999/2000. The ONS calculate the number of excess winter deaths by comparing the number of deaths in December to March to the number in August to November and April to July. In 2012 there were a total of 24000 excess winter deaths with respiratory illnesses accounting for 39 percent and circulatory illnesses 32 percent of all excess deaths.

Like me, you might look at the rise in the number of deaths during the winter months and think that it simply captures the effect of the cold, particularly on elderly people. When I looked at the data in more detail I was surprised, however, to find that the week with the highest number of deaths is almost always either the last week in the year or the first week in the new year. The figure below (from the NHS publication Keep Safe This Christmas) shows the average number of deaths on each day over the Christmas and New Year period from 2000 to 2010. Using a similar approach to the ONS, the report calculates that each year there is an excess of around 2500 deaths between the 21st of December and the 19th January.

The report tries to argue that the rise in the number of deaths over Christmas and the New Year can be explained by risk factors such as the cold, plus accidents, murder, suicide etc. While I wouldn't entirely discount these factors, like a report in the Journal of the Royal Society of Medicine last year which showed an increase in the risk of death if you are admitted to hospital on a Sunday, I would assume that a significant part of the rise in the number of deaths over Christmas and the New Year must be due to changes in staffing levels and the provision of services. Suggesting that more people work over the festive period is unlikely to make you a lot of friends but maybe someone should look at it.


