
As state pension age in the United Kingdom continues to rise, retirement seems to be getting further and further away for many people. This brings up the question of what happens after retirement. Does the rise in pension age take away from our years of retirement, or do we also see an increase in the number of years of retirement? I decided to look at life expectancy data from the World Bank to find out if changes in pension age are in line with changes in life expectancy.
A UK woman born in 1960 would be expected to live for 74.2 years, and she would be eligible to retire on her 66th birthday. That means she could spend around 11.1% of her life retired. If the same woman was born in 1978, she could retire at age 68 and would be expected to live for another 8.3 years. That’s around 10.9% of her life. This might seem like a small difference in terms of percentage. And even in absolute terms, it’s a difference of just under two months. But it does suggest that maybe retirement ages are not quite increasing in line with life expectancy. Maybe we’re just not getting older as quickly as we thought. At first glance, Figure 1 suggests that life expectancy in the United Kingdom has been levelling off since 2010.
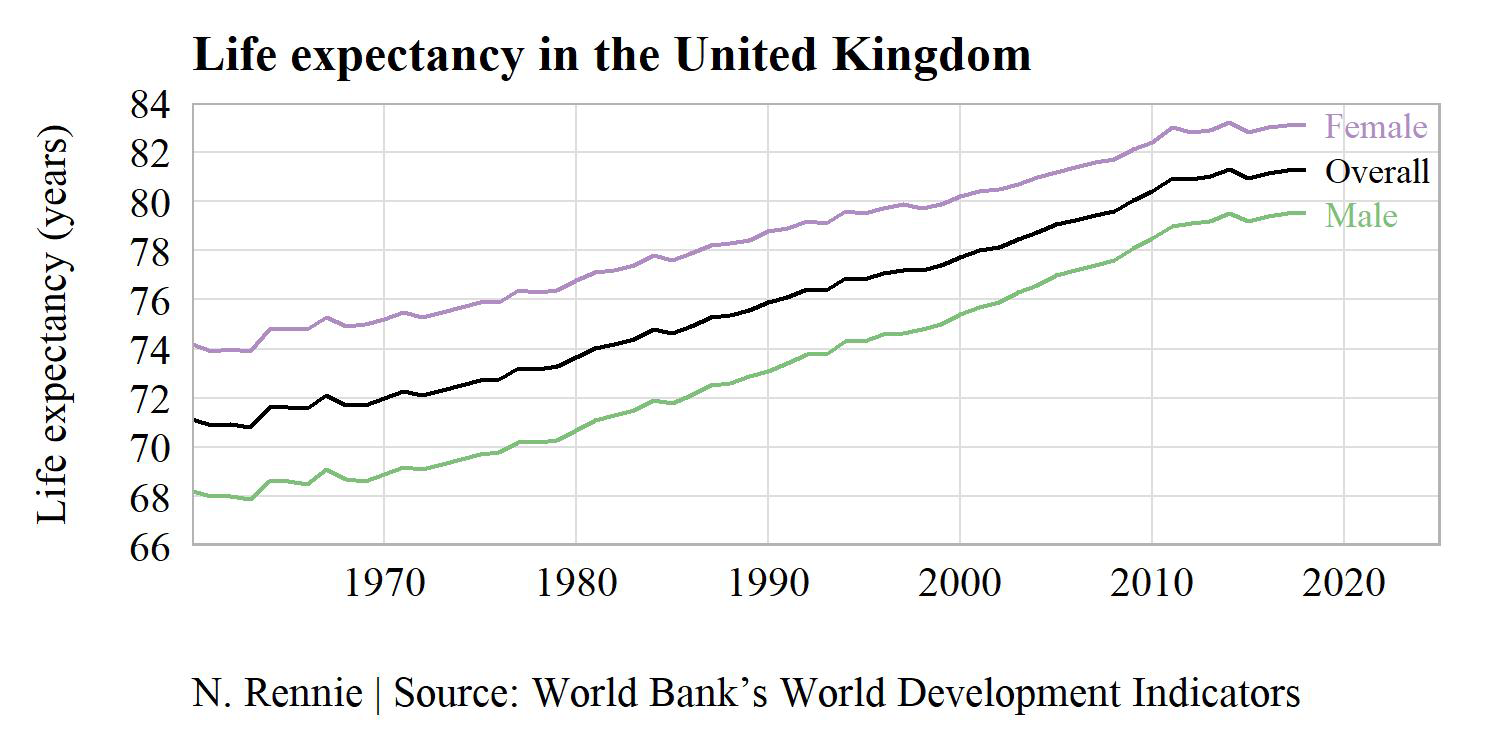
Figure 1: Life expectancy in the United Kingdom.
Testing for trends in life expectancy
We want to test if life expectancy has become constant – i.e., if the growth in life expectancy is zero. Let’s assume for a second that growth in life expectancy is not zero, and instead grows linearly each year – that is, it increases by the same amount every year. In this scenario, an equation for predicting life expectancy in any given year would be: predicted life expectancy = α + β × year. We call β the (life expectancy) growth parameter, and α is the baseline level of life expectancy. We can estimate the growth parameter β by minimising the total difference between the predicted life expectancy and the observed life expectancy. If β is equal to 0 – i.e., the growth is 0 – then the life expectancy is constant.
Assuming that life expectancy grows linearly might seem simplistic but it actually fits the data reasonably well. This is especially true if we look at any smaller section of the timeline – for example, a 10-year period rather than the entire 60-year period that data is available for.
We can also compute a confidence interval for the growth parameter. Due to the uncertainty in the estimation of the growth parameter, this interval can often be more helpful as it provides a range of values that the true value is likely to lie within. If 0 lies inside this interval, then we have no significant evidence to reject our belief that life expectancy growth is zero.1
There is a clear upwards trend in life expectancy from 1960 to 2020, as seen in Figure 1. However, we’re not really interested in the long term trend in life expectancy. Instead, we want to test if the trend has changed recently. To do this, we implement a moving window approach. We split up the timeline into 10-year segments and recalculate the estimate of β across each period. The life expectancy growth parameter is estimated from 1960–1969, then from 1961–1970, and so on. Figure 2 shows the estimated value of β and the associated confidence intervals.
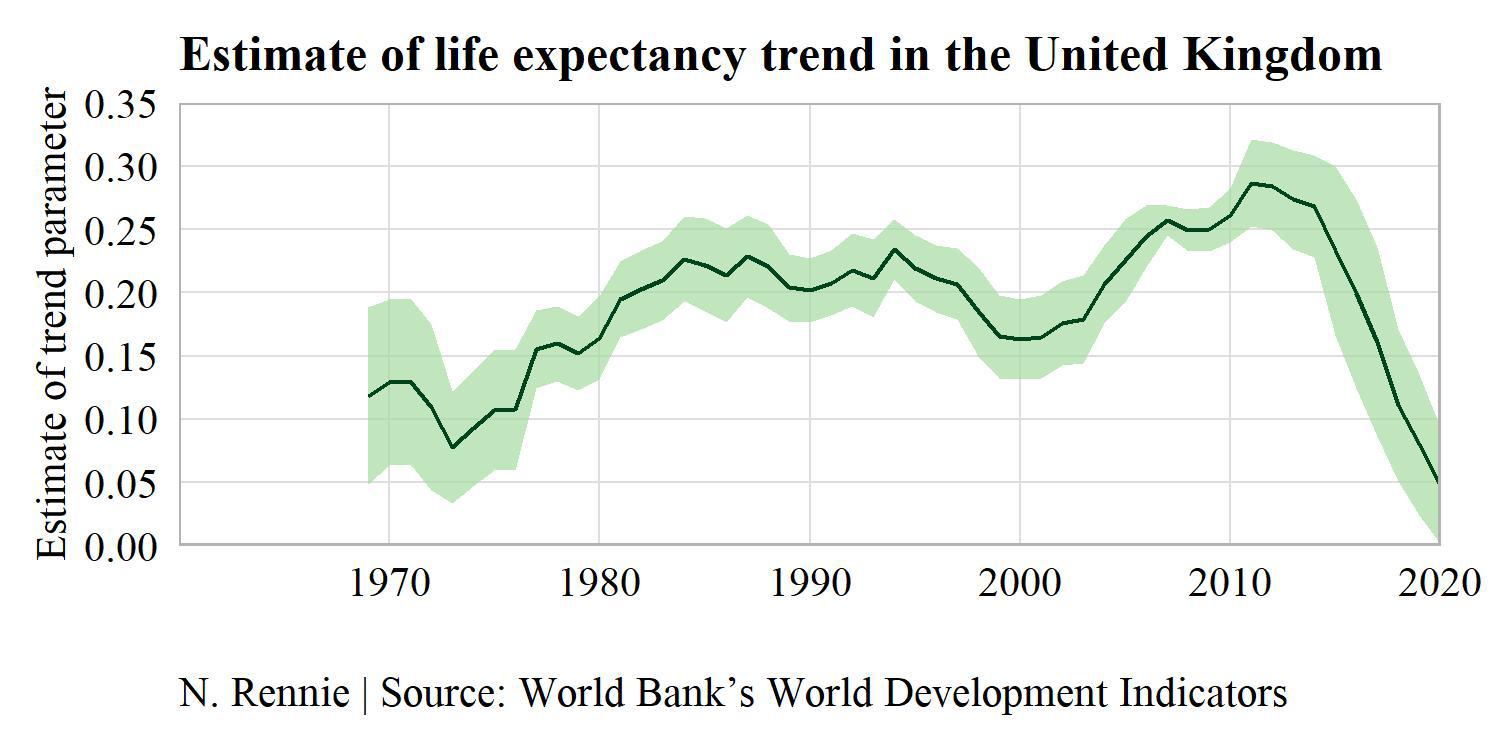
Figure 2: Estimated life expectancy growth trend in the United Kingdom.
Figure 2 shows that the estimated growth trend increased steadily until 2010, after which it started to decrease sharply. For the past 10 years (i.e., the 2011–2020 period, represented by 2020 on the horizontal axis), the average growth in life expectancy per year has been 0.048 years. That’s around 17.5 days. The confidence interval for growth over the last 10 years is (0.001, 0.093). So 0 doesn’t quite lie inside the interval, although it is very close. For the moment at least, growth in life expectancy in the UK is still positive. Even if it is very small.
Is it different for men and women?
It’s been the case for a long time that life expectancy is higher for women than for men. The causes for lower life expectancy in men have varied across history. Men are more likely to die at war, more likely to work in a job where fatal industrial accidents occur, and less likely to seek medical help early, to name just a few reasons. But, what I want to know is: who is getting older faster?
Figure 1 shows that the gap between life expectancy for men and women has been closing steadily. The gap is now just 3.6 years, compared to 6 in 1960. This tells us that the growth in life expectancy is higher for men than for women.
When we apply the same test to the life expectancy growth rate for men and women over the last 10 years, the results are quite enlightening. The estimated trend parameter is 0.069 for men, and 0.025 for women. So, the growth in life expectancy is definitely slower for women. When we look at the confidence intervals, that’s where things get interesting. For men, the interval is (0.025, 0.113). And for women, it’s (-0.029, 0.079). That means that we can be fairly certain that life expectancy is continuing to increase for men – gaining somewhere between 9 and 41 days of life expectancy per year. However, for women, we have no evidence to reject the hypothesis that life expectancy is no longer increasing.
So, although at the moment women live longer than men, that gap is closing – men are getting older but women might not be. If the trends in growth rate over the past decade continue then the gap will eventually close. Although, since the growth rates are very slow, it won’t be until around 2100 that men and women both have a life expectancy of 85.2 years.
What about the rest of the world?
It’s fair to ask whether this stalling of growth rate (at least for women) is a unique problem for the UK, or whether it’s more of a global issue. The UK is among the most developed countries, where access to clean water, better healthcare, and higher levels of education all contribute to increased life expectancy. Perhaps other developed countries follow similar patterns. Looking at life expectancy in the most and least developed countries helps to answer that question.
Human Development Index
- Life expectancy is one of three factors (the others being education and income) that are used to compute the UN Human Development Index.
- As of 2020, the five least developed countries are Niger, Central African Republic, Chad, South Sudan, and Burundi.
- Norway, Ireland, Switzerland, Hong Kong, and Iceland make up the top five most developed countries.
A quick glance at Figure 3 shows that life expectancy is much lower in less developed countries. Since life expectancy is one of the factors used to determine how developed a country is, this is somewhat expected. The growth rate of life expectancy in the least developed countries also looks quite different compared to that of the most developed countries. For the former, the growth rates are steeper and, across the entire 60 year history, not always linear. (This doesn’t affect the assumptions for our test of trend since, in a small time frame, the trend is approximately linear.)
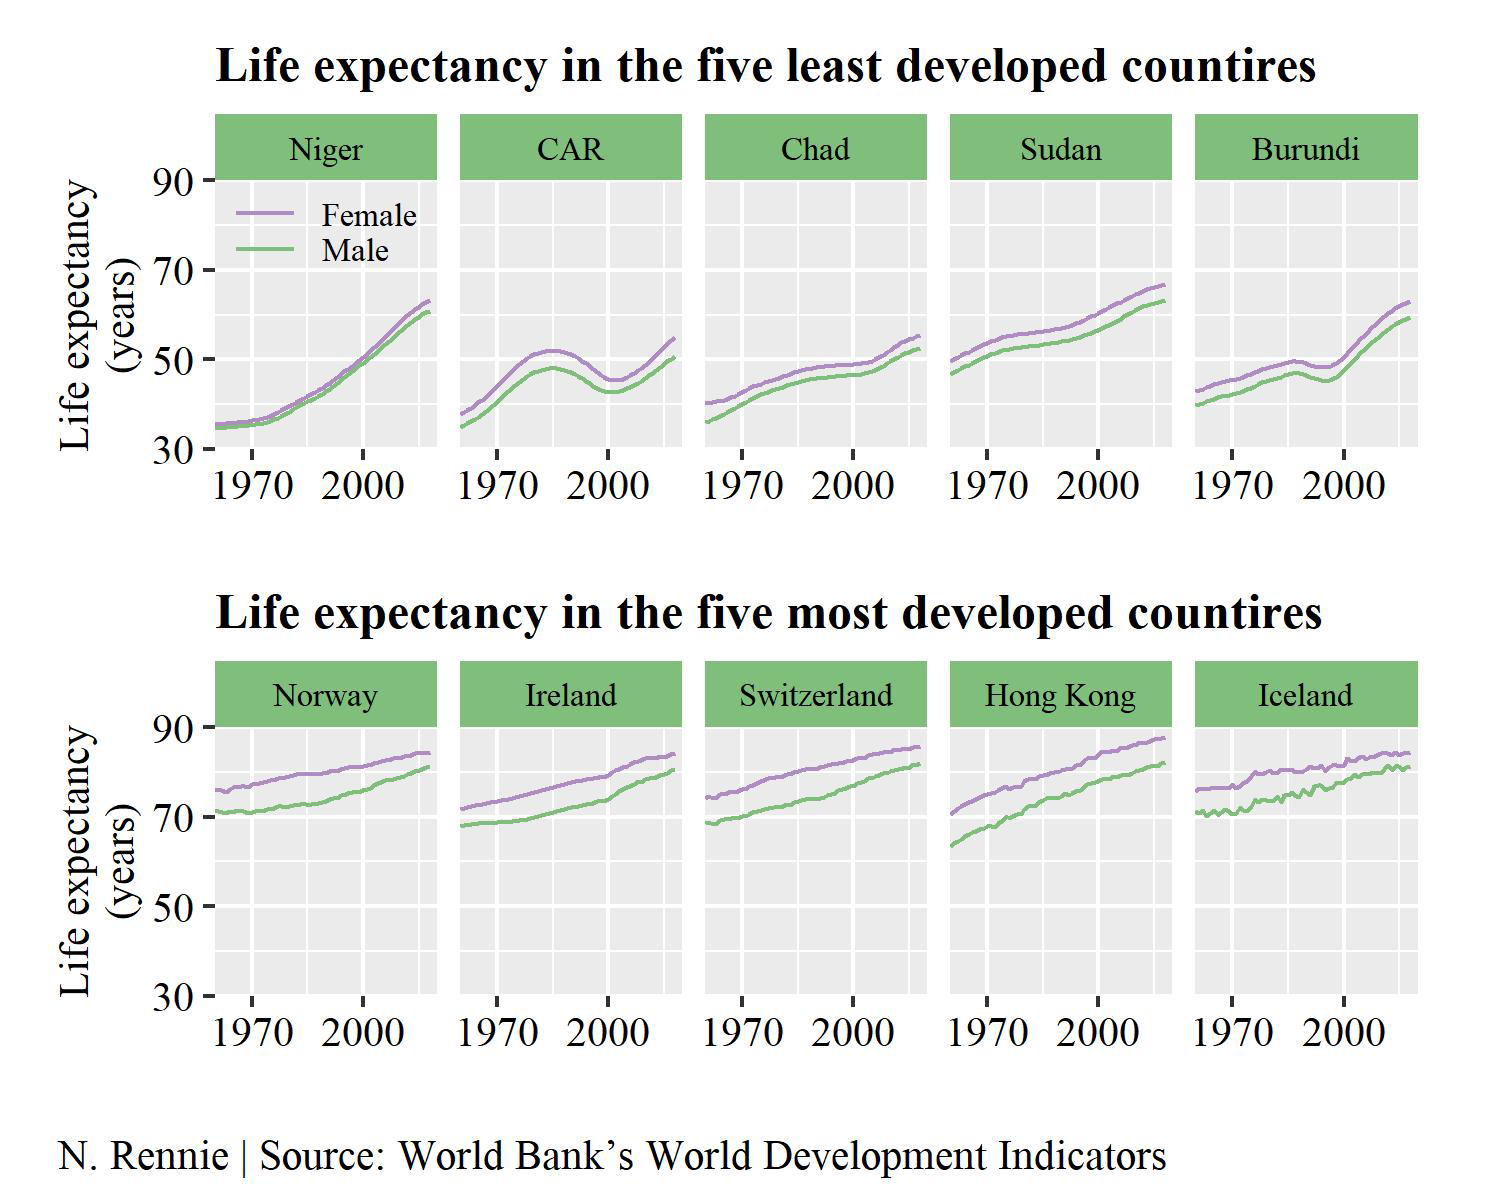
Figure 3: Life expectancy in the least and most developed countries.
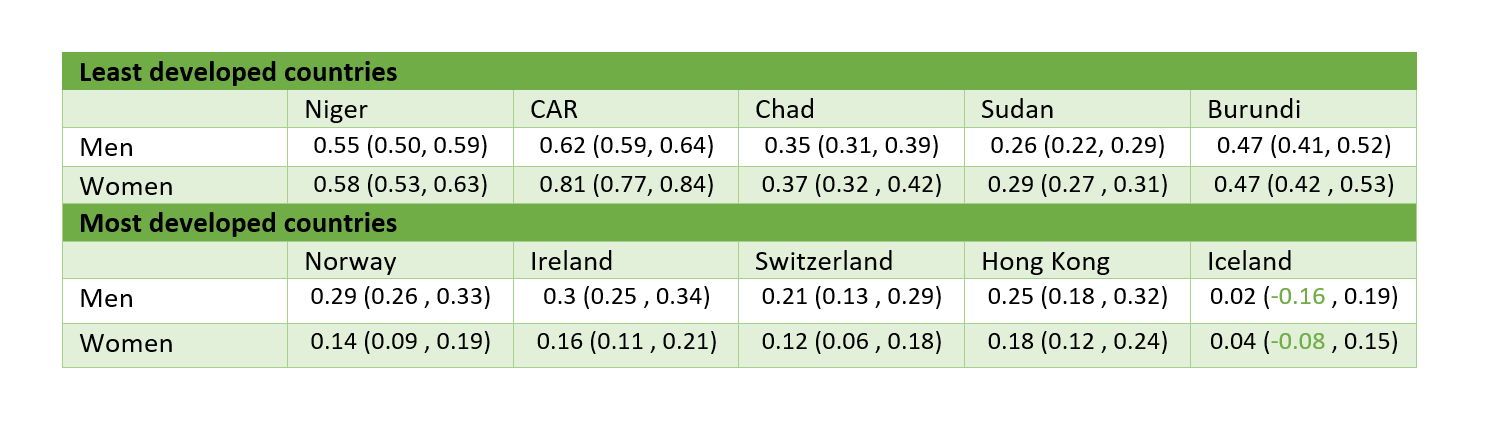
Table 1 shows the estimated life expectancy growth rates (and their associated confidence intervals) over the past 10 years. There are a few key findings that are important to highlight. First, as expected, growth rates in less developed countries are higher – peaking at 0.81 years (300 days) for women in the Central African Republic. Second, in less developed countries, growth rates for women’s life expectancy are higher than for men’s life expectancy, while in the most developed countries the opposite is true. It looks like the gap between men and women is closing across the most developed countries, whilst in the least developed countries the gap is widening. Lastly, growth in life expectancy has not stopped for the majority of the five most developed countries. The exception to this is Iceland, where growth in life expectancy has halted for both men and women. A lack of increase in life expectancy doesn’t seem to be associated with all highly developed countries. So, where in the world has life expectancy growth stalled?
Table 1: Estimated life expectancy growth trends in the least and most developed countries over the past 10 years (2011–2020).
When we apply the growth test to life expectancy for the past decade across every country in the World Bank database, only 11 countries exhibit a lack of life expectancy growth. Those 11 countries are: Bermuda, Curacao, Greenland, Grenada, Iceland, Mexico, New Caledonia, Seychelles, Syria, USA, and Venezuela. Most of these countries are ranked as high or very high in the Human Development Index. Their most recent estimates of life expectancy have an average of 75.7 years. Greenland is the lowest at 70.8, and Iceland the highest at 82.7. That’s quite a range. This does suggest that growth in life expectancy is not stalling because we have reached the limits of how old human beings can be. If that were true, we would expect countries that do not exhibit growth in life expectancy to have similar levels of life expectancy. Instead, there are a variety of other factors that are causing life expectancy to stall.
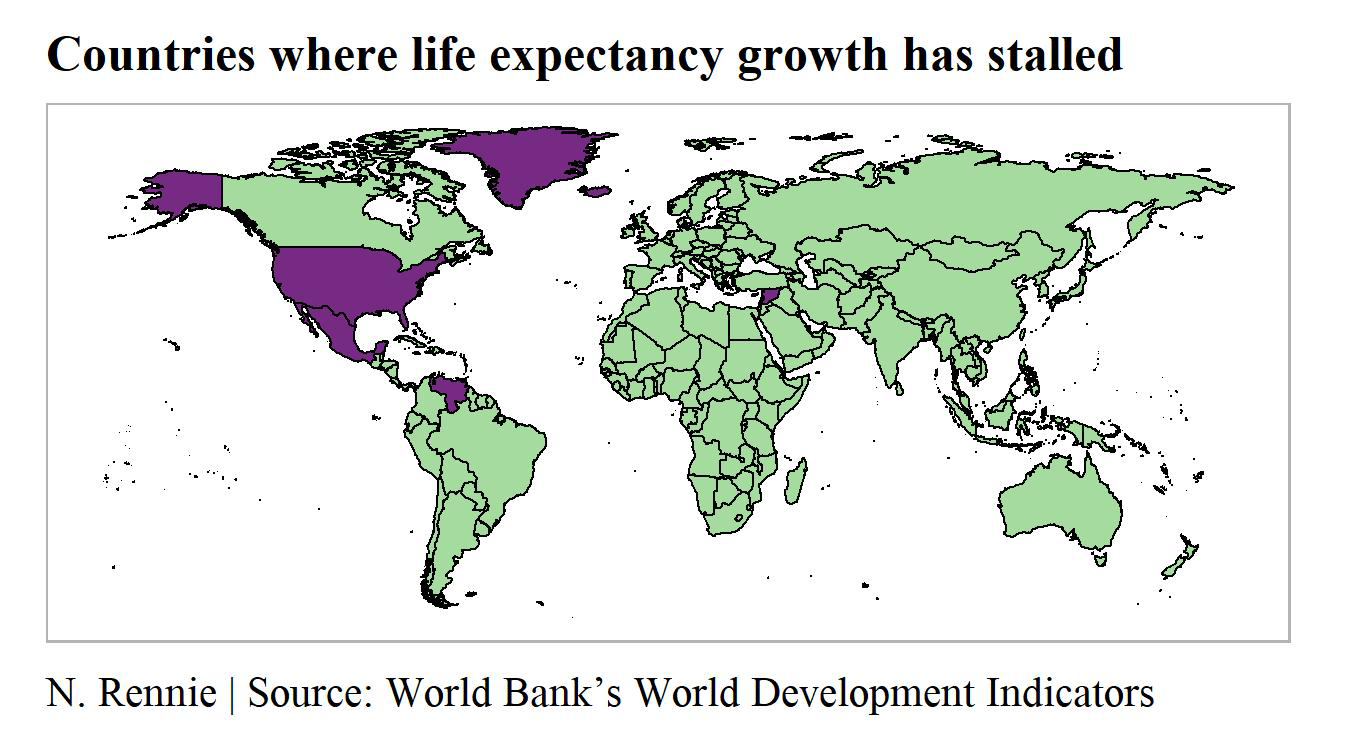
Figure 4: Life expectancy growth around the world. Countries shaded purple are those where growth in life expectancy has stalled over the past 10 years (2011–2020); countries shaded green continue to see growth in life expectancy.
Back in the UK, we’re all still getting a little bit older for now, but we’re not living as long as we used to think we would. As for me, I’ll keep working on my retirement savings since, on average, I’ll need them for around 11.5 years.
About the author
Nicola Rennie is a statistician and data scientist, passionate about using R to solve problems. She currently works as a data scientist at Jumping Rivers, having previously completed her PhD in statistics and operational research at Lancaster University.
Disclosure statement
The author declares no competing interests.
Note
This article was a finalist for the 2021 Statistical Excellence Award for Early Career Writing. The 2022 writing award is open for submissions until 31 May 2022. See significancemagazine.com/writingcomp for details.
Reference
- Nakagawa, S. and Cuthill, I. C. (2007) Effect size, confidence interval and statistical significance: A practical guide for biologists. Biological Reviews, 82(4), 591–605.


