A moment-ratio diagram allows a modeller to see several probability distributions at one time. The figure below shows the skewness versus the kurtosis for several probability distributions, where the skewness and kurtosis are defined by
and μX and σX are the mean and the standard deviation of some implied univariate random variable X.
These moment-ratio diagrams are useful for:
- quantifying the proximity between various univariate distributions based on their third and fourth moments;
- illustrating the versatility of a particular distribution based on the range of values that the various moments can assume (the two-parameter beta distribution which covers significant areas in the figure below is an example of this versatility);
- creating a short list of potential probability models based on the proximity of the point associated with a data set to a particular probability model; and
- clarifying the limiting relationships between various well-known distribution families (the Student’s t distribution approaching the standard normal distribution as the degrees of freedom increases is apparent in the figure).
A moment-ratio diagram can also indicate which distributions play a central role in probability and statistics. The normal distribution at the point (0, 3) and the exponential distribution at the point (2, 9) clearly play a central role in the figure.
Further details concerning moment-ratio diagrams is given in Vargo, Pasupathy, and Leemis.1
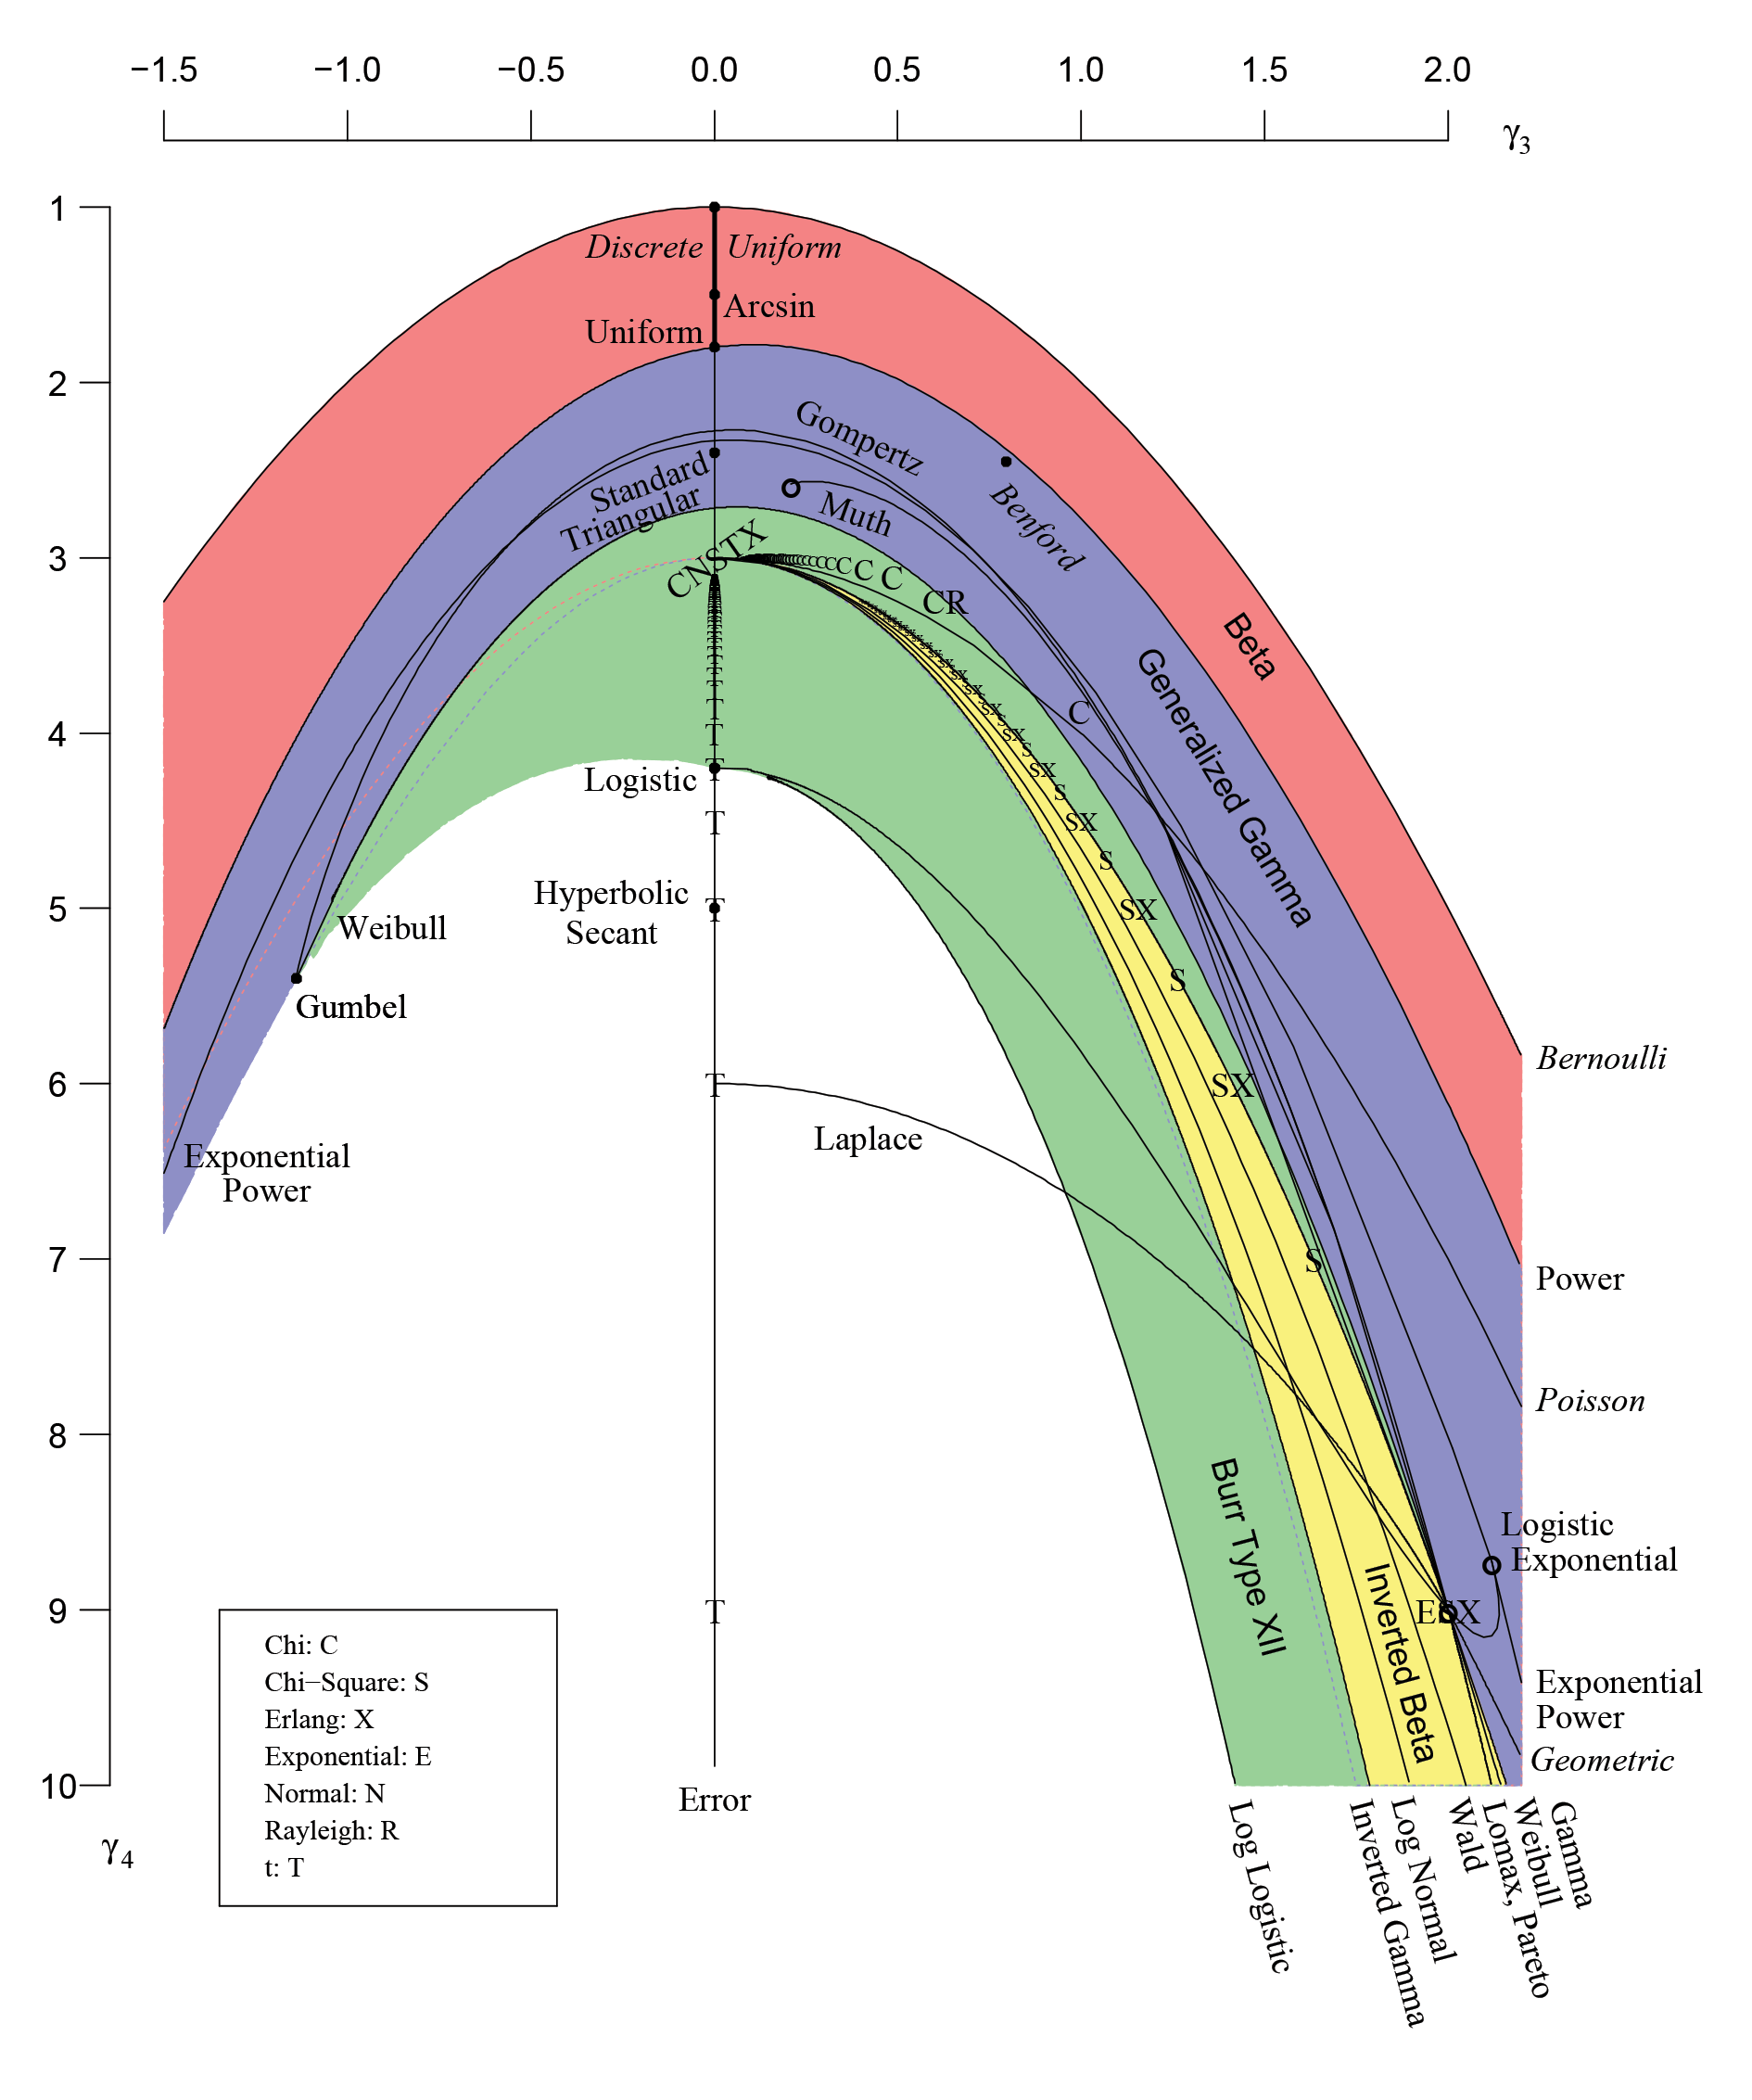
FIGURE A moment-ratio diagram of skewness versus kurtosis for several probability distributions.
About the author
Lawrence M. Leemis is a professor in the Department of Mathematics at the College of William & Mary in Williamsburg, Virginia. Raghu Pasupathy is an associate professor in the Department of Statistics at Purdue University, Indiana.
Note
This article is an online companion piece to “Notebook: The ties that bind”, by Lawrence M. Leemis and Raghu Pasupathy, published in the August 2019 print edition.
Reference
- Vargo, E., Pasupathy, R. and Leemis, L. (2010) Moment-Ratio Diagrams for Univariate Distributions, Journal of Quality Technology, 42(3), 276-286.


