Argentinian archbishop Jorge Mario Bergoglio was elected pope of the Roman Catholic (RC) church on 13 March 2013 aged 76 and took the name Francis. Just after his first year as pope, Francis jokingly mentioned that he expected to live another two or three years and that he might even retire.
None of this happened, and Francis died in office aged 88 on 21 April 2025 after serving 12.1 years. The Conclave to elect his successor begins on 7 May 2025, and comprises cardinals under the age of 80 when the papacy became vacant. These events led us – as statisticians – to reconsider the question of how long a pope can expect to live after he is elected. This has important global implications as the perceived duration of a pontificate influences the policies that the pope and his administrative apparatus, known as the Roman Curia, can propose and implement, and the reactions to these policies among the members of the RC church and beyond. Here, we address the question posed in the title by analysing post-election survival times of popes elected after 1404. The data and methods are discussed in detail in Stander et al1,2. We work with updated data as Francis and his predecessor Benedict XVI are no longer alive.
Figure 1 shows the Lexis diagram for post-election survival times for popes from 1404. As we can see from the loess smoother through the ages at death, since around 1600 popes, like the rest of the population, have generally enjoyed an increased life expectancy, leading to longer pontificates. We further examined these characteristics using survival analysis3.
 Figure 1: Lexis diagram showing post-election survival times of popes from 1404. The south-west end of each line indicates the year of and age at election. The north-east end reports the year of and age at death. A loess smoother (black curve) was fitted through the ages at death. The cross on Benedict XVI’s trajectory indicates his resignation.
We fitted a Weibull model with age at election and year of election as covariates to data from 63 popes elected since 1404. Statistical inference was performed in the Bayesian framework using Stan. This allowed us to find posterior predictive distributions for post-election survival time. Figure 2 shows the posterior predictive post-election survival time cumulative distribution function for someone becoming pope in 2013 age 76 years, such as Francis. The median of this distribution is 11.9 years. This point prediction is very close to Francis’s observed post-election time of 12.1 years. This yields a form of empirical validation of our model and provides an enormous improvement over the prediction made by Francis in 2014!
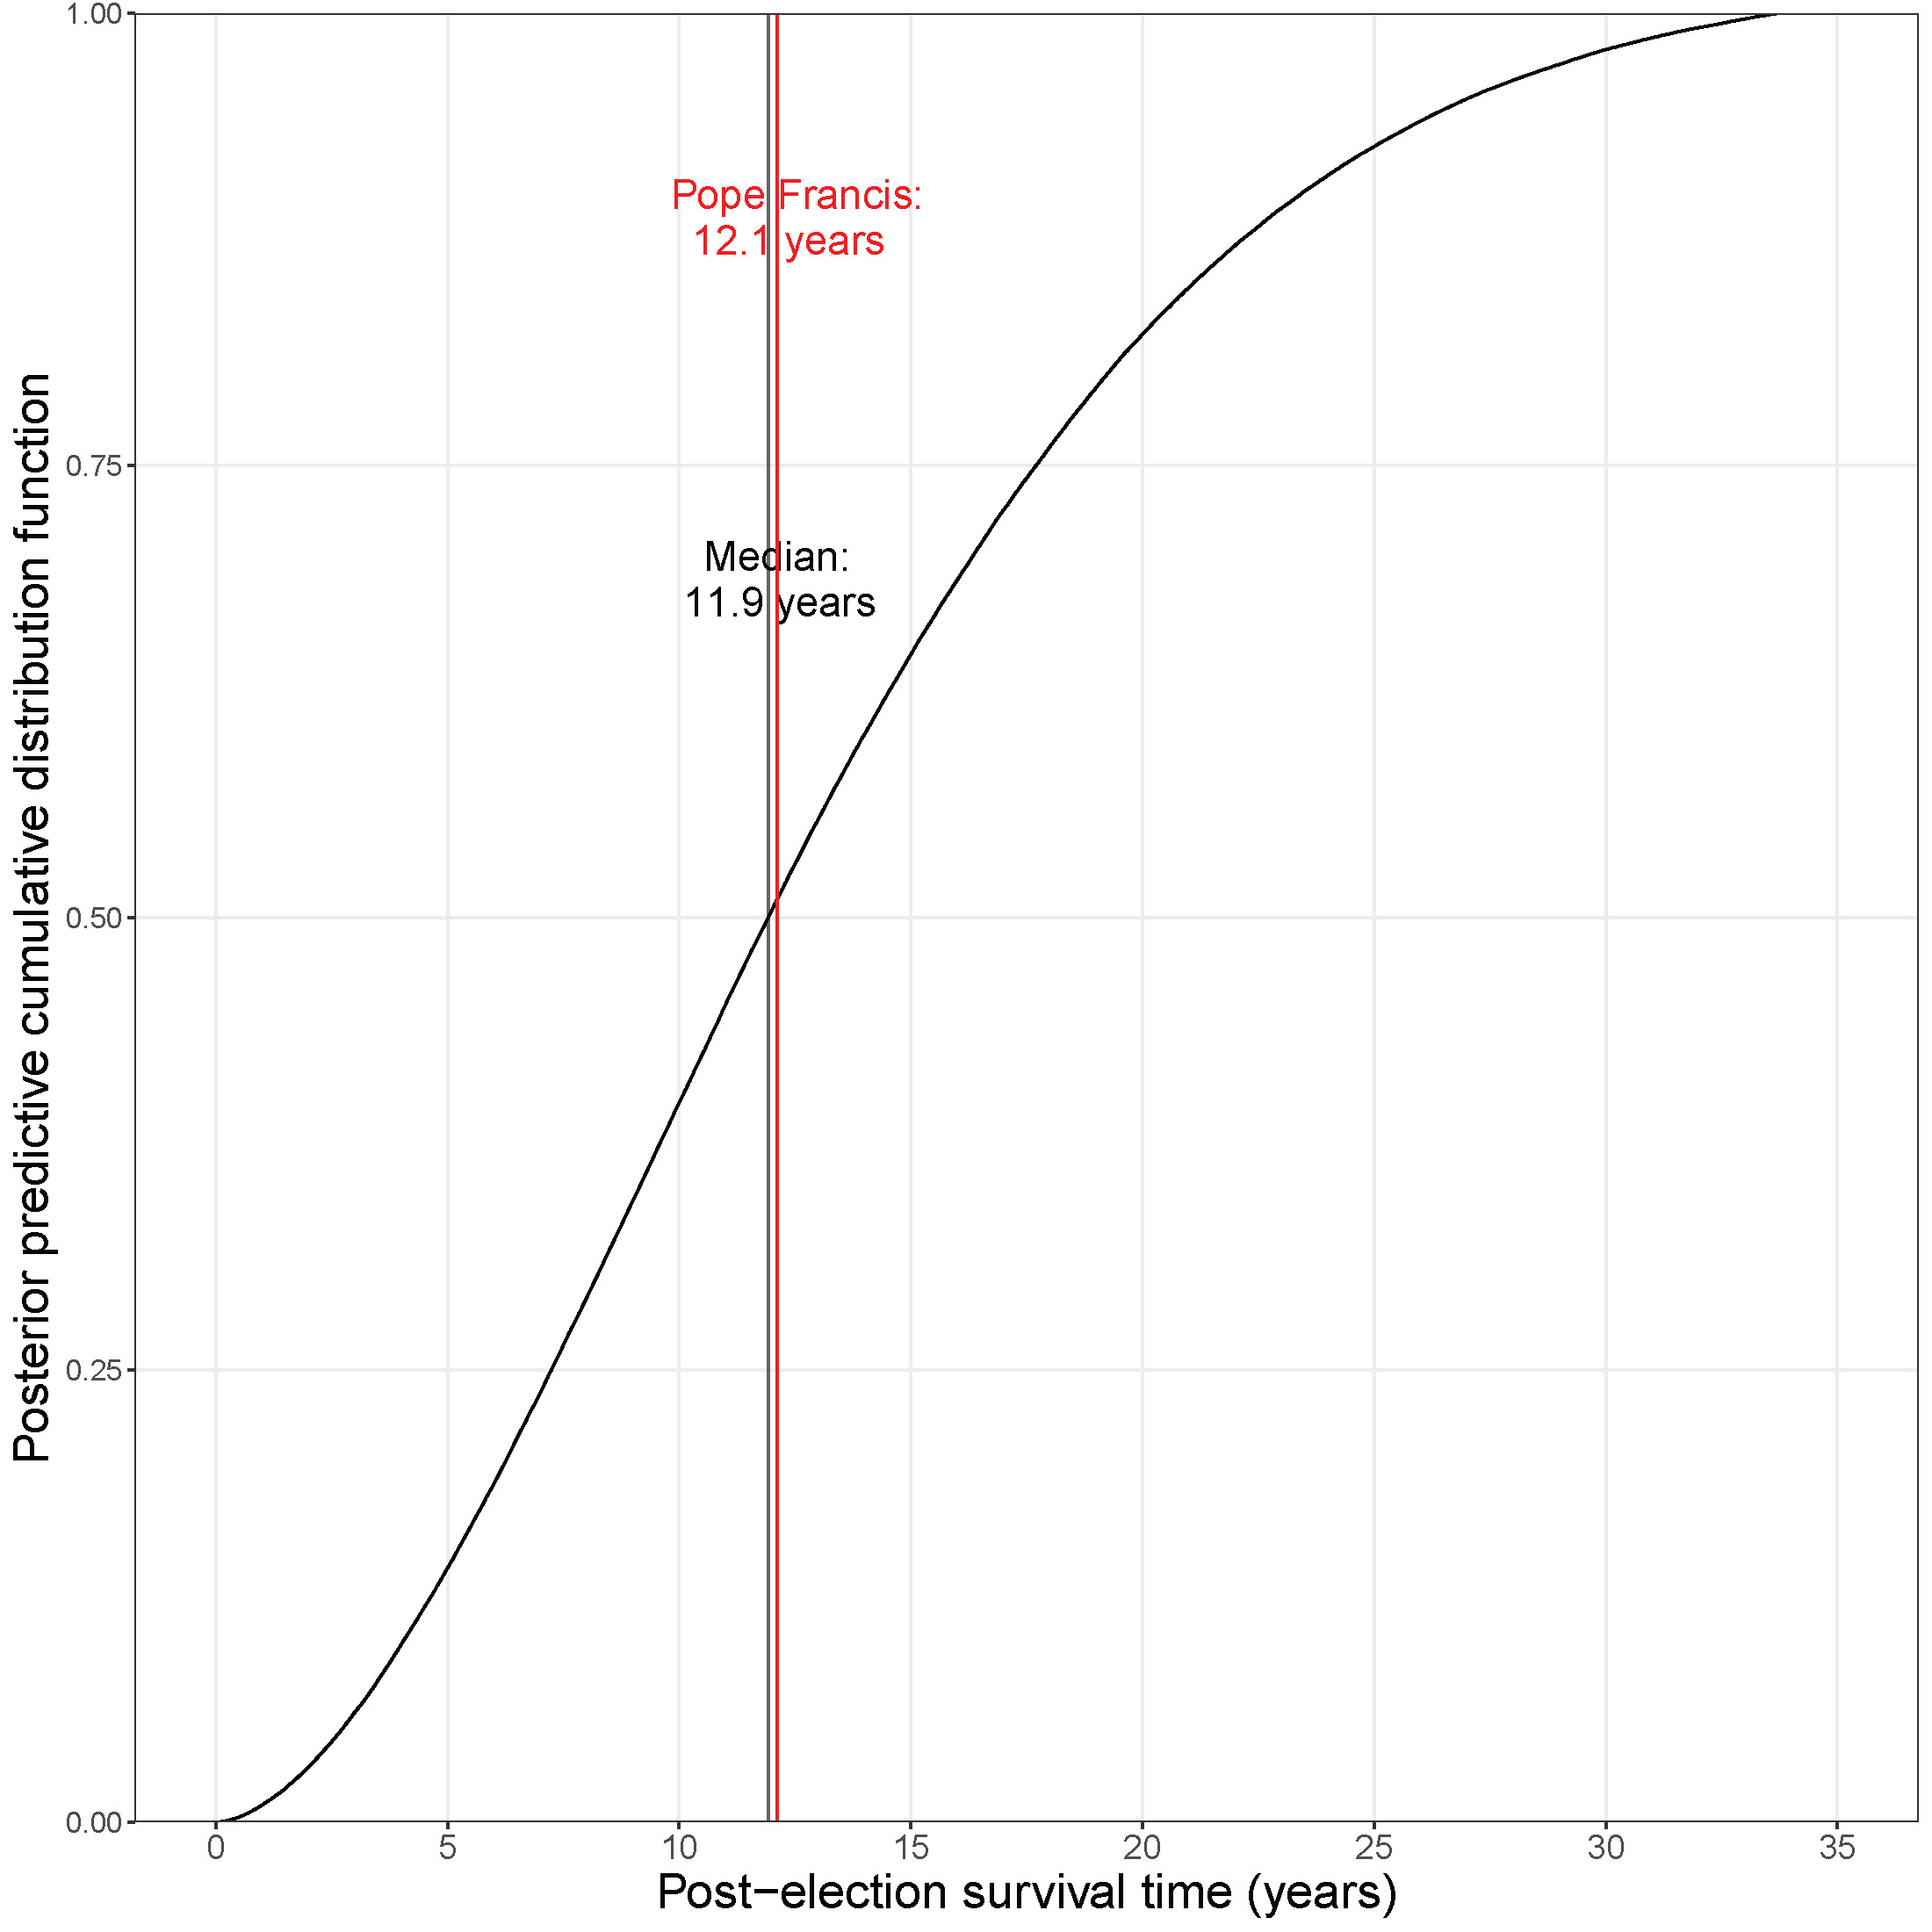
Figure 2: Posterior predictive cumulative probability distribution function of post-election survival time for a pope such as Pope Francis.
We can use our model to address the question of how long the next pope can expect to live after he is elected. As mentioned, one of our covariates is age at election. Table 1 presents the number of cardinals who will participate in the Conclave split by region, together with their median, minimum and maximum ages. These figures indicate slightly younger age distributions of cardinals from Italy, Africa, Asia, the Middle East and the Pacific compared to Europe excluding Italy and the Americas. The median ages for the former regions are below the overall median age of 72.9 years, and the latter regions are above, perhaps reflecting the changing demographic of the RC church.
| Age (years) | ||||
| Region | Number | Median | Minimum | Maximum |
| Asia, Middle East, Pacific | 27 | 67.9 | 45.2 | 79.8 |
| Africa | 17 | 68.6 | 58.1 | 79.9 |
| Italy | 17 | 70.3 | 54.4 | 79.3 |
| Latin America | 23 | 73.8 | 57.8 | 78.0 |
| Europe, not Italy | 35 | 74.5 | 51.4 | 80.0 |
| USA and Canada | 14 | 75.5 | 53.8 | 78.8 |
| Overall | 133 | 72.9 | 45.2 | 80.0 |
Table 1: The number and median, minimum and maximum age of voting cardinals by world region
Figure 3 shows the predictive cumulative probability distribution functions of post-election survival time for hypothetical popes elected at ages 50, 60, 70 and 80 years. The medians of these distributions decrease from 21.4 to 10.9 years. Quantiles can be obtained from these cumulative probability distribution functions as required. These distributions provide a guide to the longevity of the next pope, and could be helpful to the Conclave (if the cardinals taking part were allowed contact with the outside world!).
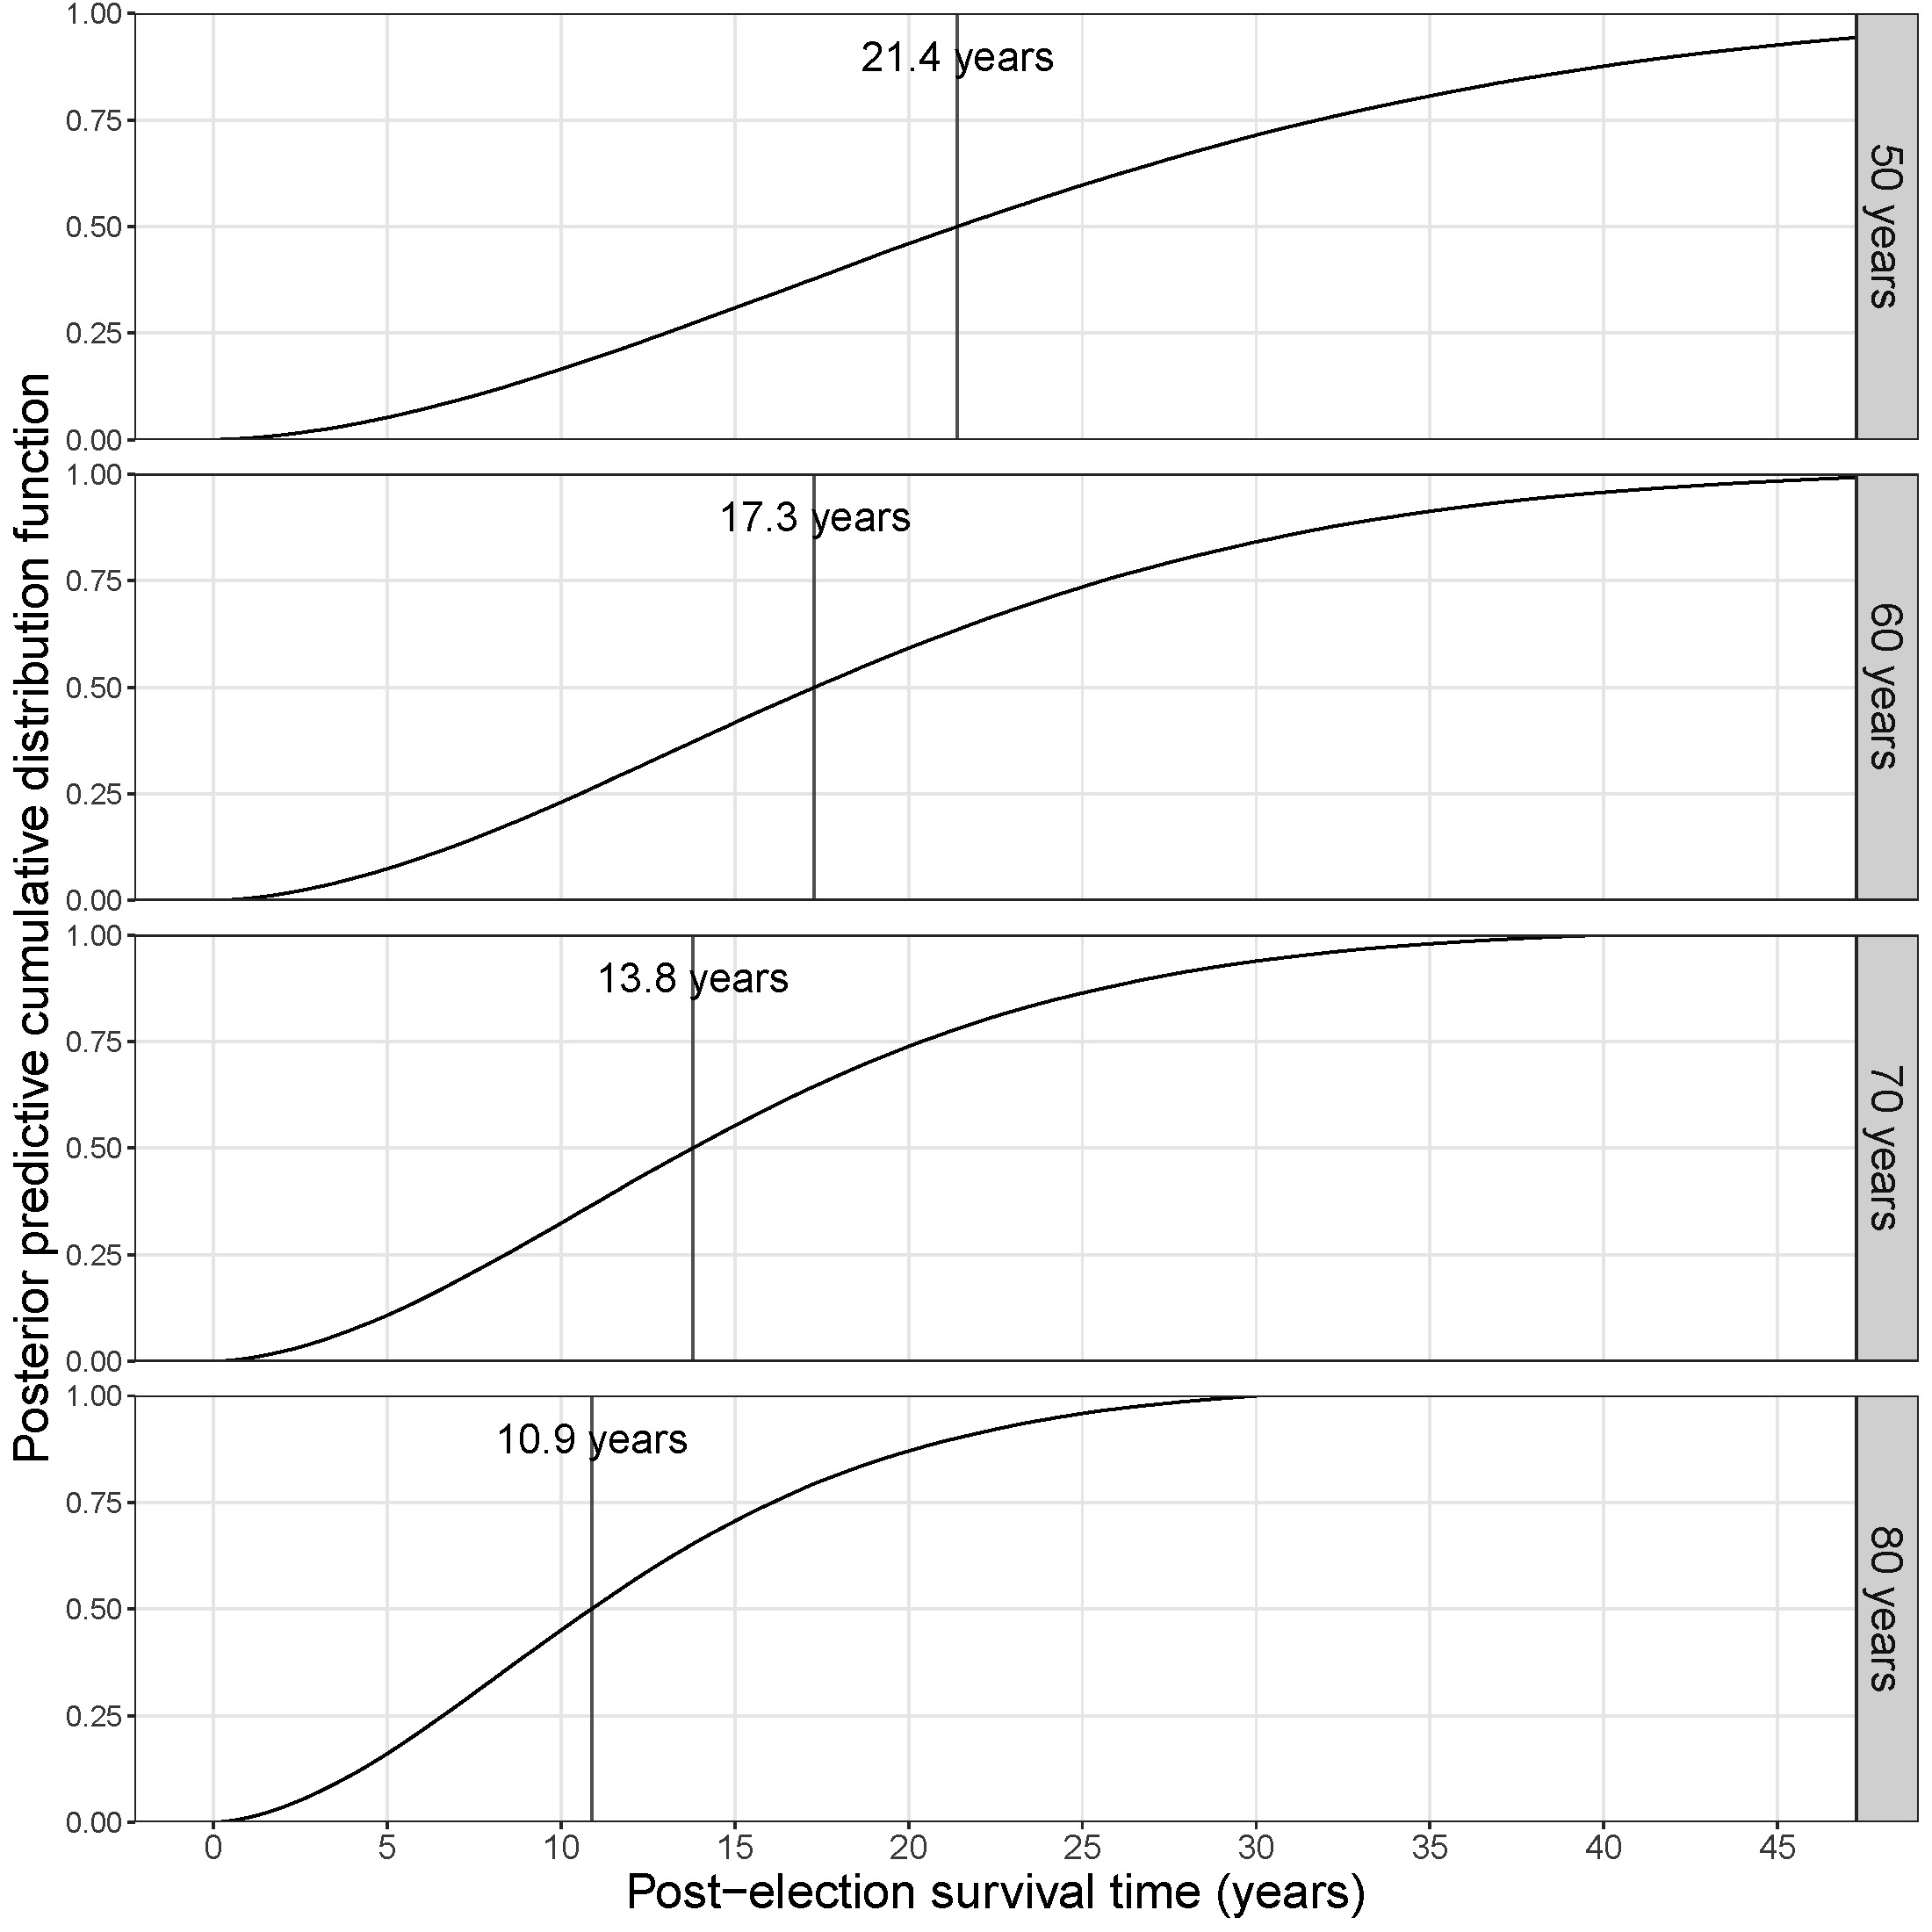 Figure 3: Posterior predictive cumulative probability distribution functions of post-election survival time for hypothetical popes elected in May 2025
As a further statistical investigation, we considered the effect that data from Benedict XVI has on our analysis. Benedict resigned the papacy on 28 February 2013, as shown by the cross on his trajectory in Figure 1. He then lived “a life dedicated to prayer” without the burden of office for 9.8 years, dying at the ripe old age of 95. If Benedict’s longevity had been influenced by his reduction of responsibilities, this may bias our results. We therefore repeated our analysis, presuming that Benedict’s post-election survival time was censored by his resignation, meaning that the model only assumed his survival to be greater than the 7.9 years of his pontificate. We found that applying censoring to Benedict led to only a small reduction in predicted survival times.
Update: on 8 May 2025, Robert Francis Prevost, 69, was elected pope. Known as Leo XIV, he is the first American to hold the post. Leo XIV has a degree in mathematics, so we hope he would enjoy being the subject of a statistical analysis. See Figure 4.
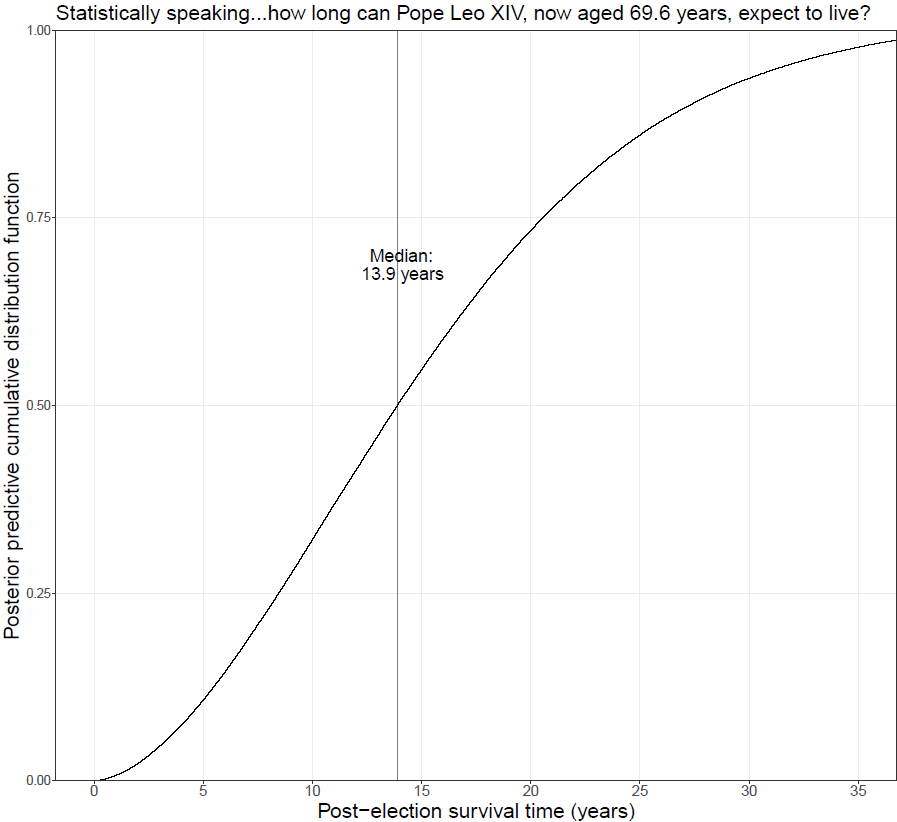
Figure 4: Posterior predictive cumulative probability distribution functions of post-election survival time for Pope Leo XIV
In this short article, we have used the power of statistical modelling, and in particular Bayesian survival analysis, to provide an answer to the question “How long can the next pope expect to live?” Actuarial tables can also help here, but often do not provide full quantification of the uncertainty involved. The Bayesian survival analysis method that we have used has wide applications in areas such as medicine and pension planning, far beyond the walls of the Sistine Chapel.
References
1. Stander J; Dalla Valle L; Cortina Borja M (2016) How long can Pope Francis expect to live? Significance, 13(1), 11-12.
2. Stander J; Dalla Valle L; Cortina-Borja, M (2018). A Bayesian Survival Analysis of a Historical Dataset: How Long Do Popes Live? The American Statistician, 72(4), 368–375.
3. Cox DR; Oakes D. (1984) Analysis of Survival Data. London: Chapman and Hall.
Acknowledgement
We thank David Teague for helpful discussions.
Julian Stander is associate professor in mathematics and statistics in the School of Engineering, Computing and Mathematics, University of Plymouth.
Mario Cortina Borja is professor of biostatistics in the Population Policy and Practice Teaching and Research Department at the Great Ormond Street Institute of Child Health, University College London and former chairman of the Significance editorial board.
You might also like: Statistically speaking… How long can Pope Francis expect to live?


