
Rugby Vision is a suite of models that produces tournament forecasts and game-by-game predictions for major rugby union competitions. Previous articles have detailed pre-tournament forecasts for the 2015, 2019, and 2023 Rugby World Cups (RWCs). Let’s evaluate the accuracy of the predictions for the 2023 RWC and other all international games.
Which teams were favourites to win the 2023 RWC?
According to Rugby Vision’s pre-tournament forecasts, the teams most likely to win the 2023 RWC were New Zealand (33.5%), South Africa (26.2%), France (20.6%), Ireland (11.9%), and England (2.3%).
Due to the nature of the draw, some lower-ranked teams had relatively high chances of qualifying for the semi-finals. The teams considered most likely to qualify for the semi-finals were New Zealand (60.7%), England (55.0%), Argentina (53.4%), France (50.6%), South Africa (50.1%), Australia (47.7%), and Ireland (33.1%).
The forecasts above could be cherrypicked to both trumpet the model, or rubbish it. For example, supporters of Rugby Vision might point out that the models did a good job predicting the likely semi-finalists, and the two pre-tournament favourites contested the final. At the same time, opponents of the models might mention that the pre-tournament favourite didn’t win, and that Australia performed worse than expected. A more robust evaluation method examines Rugby Vision’s predictions for each game and assesses whether various outcomes (e.g., favourites winning) occurred at the rate expected by the models.
Game-by-game predictions
For each game, the models predicted the probability of each team winning and the expected winning margin of the favourite. For example, in the quarter-final between Ireland and New Zealand (ie_nz in Figure 1), the models estimated that New Zealand had a 64% chance of winning and their expected winning margin was five points. This means that if (hypothetically) the game was played 100 times, New Zealand would be the favourite in each game, but Ireland would be expected to win 36 games (and New Zealand would be expected to win 64 games). In other words, the algorithm expects upsets to happen, but it doesn’t know when they will occur.
To summarise the predictions, Figure 1 displays the expected winning margin (horizontal axis) and observed winning margin (vertical axis) for the algorithm’s favourite in each game. Games with positive observed winning margins indicate that the algorithm’s favourite won, and games with negative observed winning margins represent an underdog victory. For example, in the pool game between South Africa and Scotland (za_sc, green marker in Figure 1), South Africa were expected to win by 13 points and they won by 15 points; and in the opening game (nzl_fra, black marker in Figure 1), New Zealand were expected to defeat France by 3 points but they lost by 14 points. Overall, Rugby Vision’s favourite won 41 out of the 48 games played (85.4%) and the average error was 13.2 points.
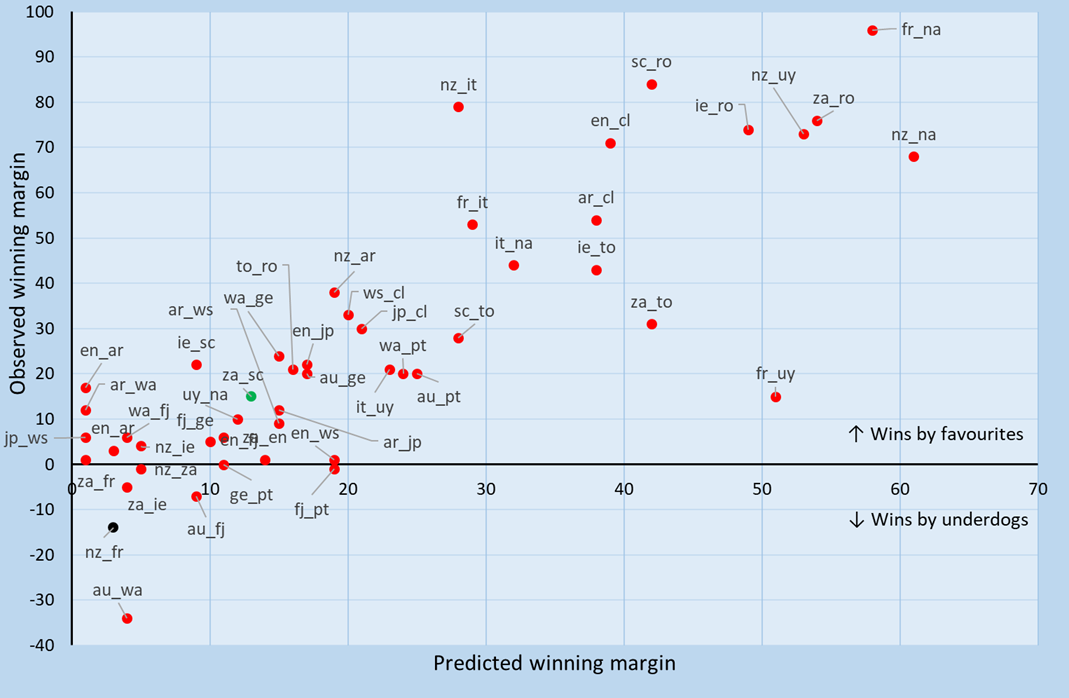
Figure 1. Predicted winning margins (horizontal axis) and observed winning margins (vertical axis) for the pre-game favourite (listed first) for each game.
The usefulness of the Rugby Vision models can be evaluated in at least two ways: (1) by comparing the accuracy of the predictions to other predictors, and (2) by examining whether favourites win (and upsets occur) at the frequency expected by the model.
Rugby Vision versus other predictors
The accuracy of Rugby Vision’s predictions relative to those by other statistical models, some representing major data analytics companies, is assessed in Table 1. Rugby Vision recorded both the most wins by favourites and the lowest average prediction error relative to other models.
| Predictor | Wins by favourites | Average error (points) |
| Rugby Vision | 41/48 (85.4%) | 13.2 |
| Rugby-Teller | 39/48 (81.3%) | 13.6 |
| Oval Insights | 39/48 (81.3%) | 14.0 |
| Rugby4Cast | 38/48 (79.2%) | 13.7 |
| Opta Sports | 37/48 (77.1%) | 17.0 |
Table 1.RWC 2023 performance by statistical models.
Rugby Vision’s accuracy for the last three RWCs is compared to that for outcomes expected by betting markets/bookmakers in Table 2. For bookmakers, the prediction error is the difference between the observed margin and the bookmakers’ handicap for the favourite, where the handicap is the number of points taken away from the favourite’s final score to make a game an even contest (and corresponds to the bookmakers’ expected winning margin). In the 2023 RWC, Rugby Vision registered more wins by favourites than bookmakers did, but bookmakers had a slightly lower average error. Aggregated over the last three RWCs, Rugby Vision has recorded more wins by favourites and a lower average error than bookmakers.
| Period | Wins by favourites | Average error | ||
| Rugby Vision | Bookmakers | Rugby Vision | Bookmakers | |
| RWC 2015 | 41/48 (85.4%) | 41/48 (85.4%) | 11.5 | 12.8 |
| RWC 2019 | 40/45 (88.9%) | 40/45 (88.9%) | 11.2 | 11.8 |
| RWC 2023 | 41/48 (85.4%) | 37/48 (77.1%) | 13.2 | 13.0 |
| Overall | 122/144 (86.5%) | 118/141 (83.7%) | 12.0 | 12.5 |
Table 2. Rugby Vision versus bookmakers: Wins by favourites and average prediction error.
Table 3 reports the number of spread/handicap bets won by Rugby Vision. As the handicap for each game is intended to result in a wager on either team having a 50% chance of succeeding, success rates greater than 50% for each of the last three RWCs are further evidence that predictions by Rugby Vision are more accurate than outcomes expected by betting markets.
| Period | Rugby Vision |
| RWC 2015 | 28/48 (58.3%) |
| RWC 2019 | 26/45 (57.8%) |
| RWC 2023 | 26/48 (54.2%) |
| Overall | 80/141 (56.7%) |
Table 3. Spread bets won.
In a final comparison to other predictors, for the 2023 RWC, the algorithm finished in the top 4% of the more than 400,000 participants in Superbru’s RWC prediction league, which awarded points based on prediction accuracy in each game. In the 2019 and 2015 RWC, the algorithm finished in, respectively, the top 9% and 13% of participants.
Did Rugby Vision expect the expected?
Did favourites win (and upsets occur) at the rate expected by Rugby Vision? In the 2023 RWC, the models expected 39 wins by favourites and the actual number was 41. Aggregating over the 2015, 2019 & 2023 RWCs, the models expected favourites to win 119 games and the observed number of wins by favourites was 122. These results indicate that upsets occurred at close to the rate expected by Rugby Vision.
To further evaluate the calibration of the Rugby Vision models, Table 4 displays wins by favourites for alternative win probability brackets. To ensure a large sample, the evaluation uses all available out-of-sample predictions by Rugby Vision (predictions for 1,018 games played between 2012 and 2023). In each estimated win probability bracket, the proportion of wins by favourites is within the bounds of the bracket. For example, in games for which the estimated win probability for the favourite was between 60% and 69%, favourites won 64.9% of the time. These observations indicate that the Rugby Vision models are well calibrated.
| Estimated win probability (%) | Wins by favourites (ratio) | Wins by favourites (%) |
| 50-59 | 81/141 | 56.7% |
| 60-69 | 100/154 | 64.9% |
| 70-79 | 148/191 | 77.5% |
| 80-89 | 180/208 | 86.5% |
| 90+ | 304/324 | 93.8% |
Table 4. Wins by favourites for alternative win probability brackets, 2012 – 2023.
Summing up
Predictions by Rugby Vision outperformed predictions by other predictors and outcomes expected by betting markets in recent RWCs. The Rugby Vision models appear to be well calibrated and provide a reliable forecast of likely game outcomes. That said, no model can foretell the future and unlikely results should be expected to occur from time to time.
Additional information
Rugby Vision rankings and predictions are available at www.rugbyvision.com and the social media channels Twitter.com/rugbyvision and Facebook.com/rugbypredictions.
Niven Winchester is a professor of economics at the Auckland University of Technology, and a senior fellow at Motu Economic & Policy Research.


