

Will the New Zealand All Blacks win their third successive Rugby World Cup (RWC) title in Japan in November? Who are their biggest rivals? Which team will be the ‘dark horse’? To answer these questions, we apply statistical models developed by Rugby Vision to estimate each team’s chances of reaching various stages of the competition, such as qualifying for the quarterfinals or winning the tournament.
Rankings teams
Our analysis first builds a rating system for international rugby teams, and then applies the ratings to estimate the expected result for each RWC game.
Rugby Vision uses a bespoke Elo-type rating system that is based on past match results and accounts for the quality of the opponents played. In this system, a team gains rating points if it performs better than expected, and loses rating points if it performs worse than expected. More specifically, a team gains ranting points if it:
- wins when it is expected to lose,
- wins by more points than expected, or
- loses by fewer points than expected.
Conversely, a team loses rating points if it:
- loses when it is expected to win,
- wins by fewer points than expected, or
- loses by more points than expected.
All else equal, changes in ratings points are largest when a team wins when it is expected to lose or loses when it is expected to win. In the algorithm used to updated rating points, results from more recent games are more influential than results from less recent games.
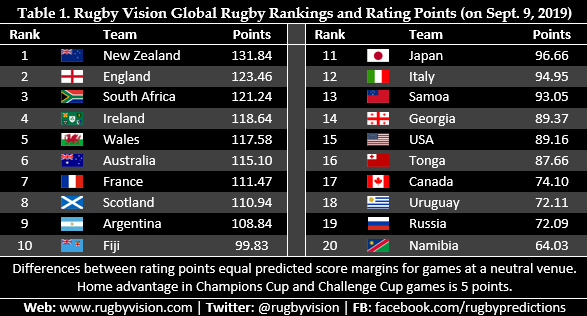
Current Rugby Vision global rankings and ratings points for the 20 teams that qualified for the 2019 RWC are displayed in Table 1. There are several differences in these rankings compared to the official World Rugby rankings. Notably, New Zealand are the top-ranked team in the Rugby Vision rankings but Ireland are number one in the official rankings. Additionally, England and South Africa are ranked higher by Rugby Vision than World Rugby.
Predicting game results
In the Rugby Vision rankings, unlike in the official ratings, differences between rating points for any two teams equal the predicted score margin for a game played at a neutral venue. For example, if New Zealand played second-ranked England, they would be expected to, on average, win by 8.38 points (131.84 minus 123.46), or 8 points when rounded to the nearest whole point. Home advantage is estimated to be worth 5 points, so – for the RWC – this amount is added to Japan’s rating points when predicting games involving the host nation.
If the strongest team (according to Rugby Vision’s rankings) always won, Figure 1 shows how the knockout stages of the 2019 RWC would play out.
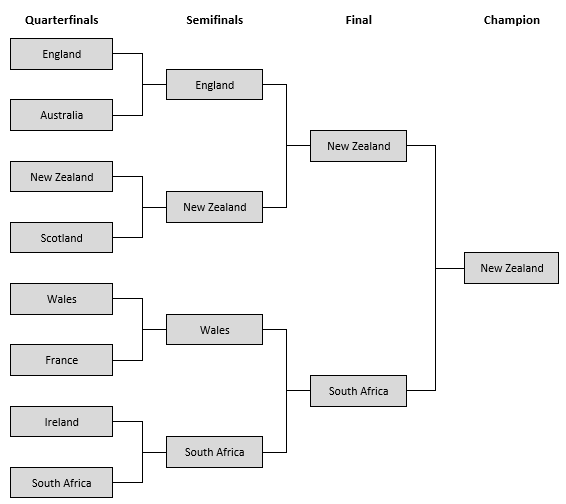
FIGURE 1 RWC knockout matchups assuming that the highest-ranked team always wins.
However, it would be highly unlikely if all games were won by the favourites. Upsets do happen, and examples from past RWCs include Japan’s victory over South Africa in 2015 and New Zealand’s early exit from the 2007 tournament. The trouble is, when trying to predict tournament outcomes, we simply don’t know when those upsets will occur.
To get a fuller picture, we need to account for the deviations around average expected scores (as estimated above). To see why this is important, consider a hypothetical case where New Zealand played England 100 times. The ratings estimate that the All Blacks would beat England by 8.38 points on average, but in some of those 100 games New Zealand would win by more or fewer than 8 points, England would win some games, and a small number of games would result in draws. It turns out that, according to Rugby Vision’s model, the All Blacks would win 71 of the 100 games, England would win 26, and three games would be tied.
Simulating the RWC
To determine the probability of each team advancing to various stages of the RWC, we simulate the tournament 10,000 times. For each game in each simulation, a different value is used to account for the variation in the expected score margin. On average, higher-ranked teams have a greater chance of progressing to the various knockout stages than lower-ranked teams, but sometimes lower-ranked teams beat higher-ranked teams in the simulations.
Estimated probabilities of each team qualifying for the quarterfinals, semifinals, final, and winning the Webb Ellis Cup are displayed in Table 2.
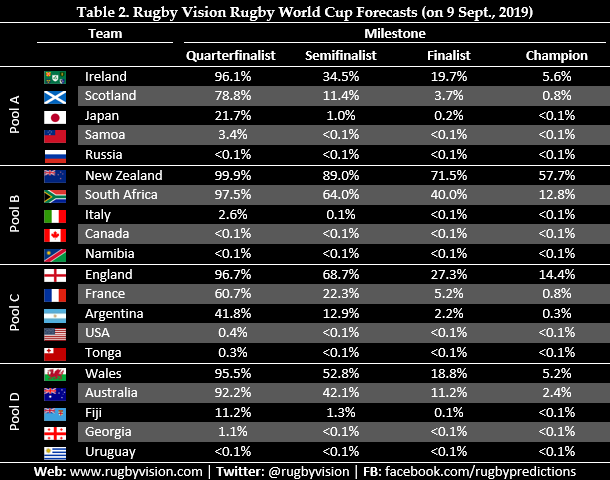
According to Rugby Vision, New Zealand are clear favourites with a 71.5% chance of qualifying for the final and a 57.7% chance of winning the competition. Despite playing in arguably the toughest pool, England are second favourites, with a 14.4% chance of winning the tournament, followed by South Africa on 12.8%. Ireland – World Rugby’s top-ranked team – have only a 34.5% chance of being a semifinalist (and a 5.6% chance of being champion), as they will likely meet New Zealand or South Africa in a quarterfinal.
The estimates also reveal that while it is highly likely that New Zealand and South Africa will qualify for the knockout stages in Pool B, other pools are more competitive. In Pool A, Japan has a 21.7% chance of qualifying for the quarterfinals, at the expense of Ireland or Scotland; there should be a tight competition between France and Argentina for the second quarterfinal spot in Pool C; and there is an 11.2% chance that Fiji will cause an early exit for either Wales or Australia in Pool D.
So, that is how statistical analysis thinks the RWC will play-out. Let the (fun and) games begin!
Note
For updates on the rankings, RWC forecasts, and game-by-game predictions, follow @rugbyvision or visit rugbyvision.com.
About the author
Niven Winchester is a principal research scientist at the Massachusetts Institute of Technology, a senior fellow at Motu Economic & Policy Research, and a principal at Vivid Economics.


