

And in case you didn’t know, the RPI is the Retail Price Index; the CPI is the Consumer Price Index.
Why does it matter?
Lots of payments are linked to inflation – pensions, benefits, index-linked savings… The higher the inflation figure, the higher the payments. RPI almost always gives a higher figure for inflation than CPI does. The decision will cost the Treasury – and private pension funds – billions in the higher payments it will have to make.
Others affected?
Students – repayments on student loans are calculated using RPI. Savers, with their index-linked savings and bonds. And the Treasury’s income as well as its expenditure: taxes on fuel, alcohol and tobacco are all linked to inflation.
What’s the difference between the two?
It is described in (great) detail by Jill Leyland, who is the Chair of the RSS National Statistics Working Party, on the Significance site here. That is for those of you who want the full, authoritative, and definitive story with every ramification. A quick and clear explanation, by our own Andrew McCulloch, is here. (See also his brilliant piece next to this on the home page.) A (very) potted version is this:
Both RPI and CPI measure inflation. Both of them do it by taking a basket of goods – food, clothes, petrol – looking at what they cost last year, looking at what they cost now, and finding the proportional difference.
But the CPI leaves the costs of your home out of the basket – so rises in mortgage payments, rents, and council tax, which in real life you pay, don’t get reflected in it. The RPI does take account of those costs.
There is a mathematical difference as well. The RPI calculates its ‘proportional difference’ using the arithmetical mean between the old price and the new, the CPI uses the geometric mean. The end result is that the RPI always gives a bigger figure for inflation than the CPI.
How much difference does that make in practice?
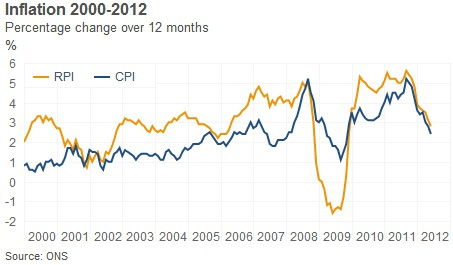
Each year the RPI rises on average 1.2 percentage points more than the CPI. Here’s a graph. The exceptional time in 2009 when the RPI suddenly plummeted to less than the CPI was the time of the financial crash when mortgage interest rates suddenly went to near-zero.
Which means?
The RPI rises more quickly than the CPI. So if your annual pension rise is based on the RPI, you will get more; if it is based on the CPI, you will get less. The same is true if you have savings in index-linked bonds.
If the ONS had decided to change to CPI, your future pensions and savings would have been less – in the long term, quite a bit less. Sure, the difference is of the order of 1% a year; but after ten years, that comes to more than 10 percent less, because it is compounded. For example, Andrew McCulloch tells us that assuming an RPI of 3% and a CPI of 2.33% per annum, and a retirement duration of 25 years, the change from RPI to CPI reduces the value of a public service pension by approximately £30,000. Sticking to RPI adds around £5,000 to the total repayments on a £25,000 student loan compared to indexing them using the CPI.
Who are these ONS people anyway?
The ONS consulted widely before making its decision. There were strong arguments – and strong pressure groups – on both sides. So this might be a good place to point out that the ONS is independent of government. There is also an independent watchdog, the Statistics Authority, set over it to make sure (among other things) that it does its job properly. The Statistics Authority has a reasonably-new man in charge of it – the hugely-respected Andrew Dilnot.
Which one is right, CPI or RPI?
Neither. Both are artificial man-made constructs; each of them measures what it measures, and neither of them is ‘right’ or ‘wrong’. Used properly, both are useful tools, but that is all that they are.
What are the arguments for sticking to RPI?
a) Continuity. This is the big one that the ONS are stressing. Continuity matters. How can we compare like with like if halfway through you start measuring something completely different instead?
b) Psychology. No change implies no immediate losers: no-one actually feels worse off straight away. There are people who would have felt better off straight away if the ONS had decided on a change – employers paying pension schemes, for one. They are losers, but they don’t actually feel worse off than before. But there are people who would have felt worse off immediately if there had been a change, and they would have… what? Taken to the streets in protest? Possibly. It would have been seen as a government accounting trick to make people poorer. So the psychological damage from no change is less.
What are the arguments for changing to CPI?
a) Accuracy. It has been strongly argued that CPI is a more accurate measure – its maths is truer. It actually reflects the inflation that most people experience. The maths that works out the RPI has been described as ‘bonkers’.
b) The RPI does not meet international standards. It doesn’t match what other countries do.
c) The RPI is more volatile. It shoots up and down quite a lot. There are arguments for using the CPI on the grounds that it changes more slowly.
d) Changing to the CPI would save the Treasury an awful lot of money. That is a very strong argument – in the Treasury’s view, anyway.
So – pensioners and savers rejoice that we are keeping the status quo….?
Nearly, but not quite; because…the ONS will publish alongside it each month not one, but two new ways to measure inflation: the RPIJ – which uses the basket of goods of the RPI, but maths more like CPI – the ‘J’ stands for Jevons, who is the bloke who worked out the geometric formulae it will use; and the CPIH – which is the CPI with housing prices added in.
To which one can only say ‘Blimey…Four measures of inflation to choose from each month?’


