

Pupils returned to school in England, Wales and Northern Ireland after the summer break mainly during the week beginning 31 August 2020. In Scotland, they returned earlier in August. The risks associated with returning to school have been the subject of much recent political and scientific debate; see, for example, The Royal Society’s DELVE Initiative reports on balancing the risks of pupils returning to schools and on statistical designs for studies into Covid-19 transmission in schools.
The Royal College of Paediatrics and Child Health states that “the prospect of having to close schools again, in the midst of winter, is not a happy one and must be avoided”. The European Centre for Disease Prevention and Control recently published ten key messages in a report about Covid-19 in children. A meta-analysis by Viner et al. found that people younger than 20 years have a lower susceptibility to Covid-19 than adults, but was inconclusive as to whether transmission of the disease by children is lower than by adults. Although our emphasis is on schools, much of this article is relevant to students returning to universities. In many English universities, Freshers’ week started on Monday, 21 September. There are already reports of many students having to self-isolate (the most recent example at the time of writing comes from the University of Nottingham), and even the suggestion, later played down by the Prime Minister’s spokesman and other politicians, that some students may not be able to return home at Christmas.
In order to make the operation of schools “Covid-19 secure”, government guidance requires all pupils in Year 7 and above (age 11 and up) in England to wear face coverings in communal areas outside the classroom where social distancing cannot be maintained. Face coverings are not necessary in the classroom. The number of contacts between people has been reduced by keeping groups separate in “bubbles”. Social distancing in schools has recently been discussed in a Significance article, which makes three excellent recommendations. For full details of government guidelines, see, for example, Section 2 of “Guidance for full opening: schools”. There are variations in practice in the other United Kingdom (UK) countries. All these precautions are especially important when seen in the context of the progression of the pandemic. We illustrate this for the UK in Figure 1, where the growth in the number of documented cases seems to be exponential since the middle of August or before. The associated doubling time is around 12.2 days, although this value is based on quite limited data. Details of the model fitted and of the meaning of the doubling time are given here. We discussed growth models for the Covid-19 pandemic in a previous Significance article.
The recent rapid growth in cases in the UK has been the cause of considerable concern. Prime Minister Boris Johnson addressed the nation on 22 September to announce new restrictions intended to tackle the rise in cases. In this note, we present suggestions about organization in schools based on some statistical considerations.
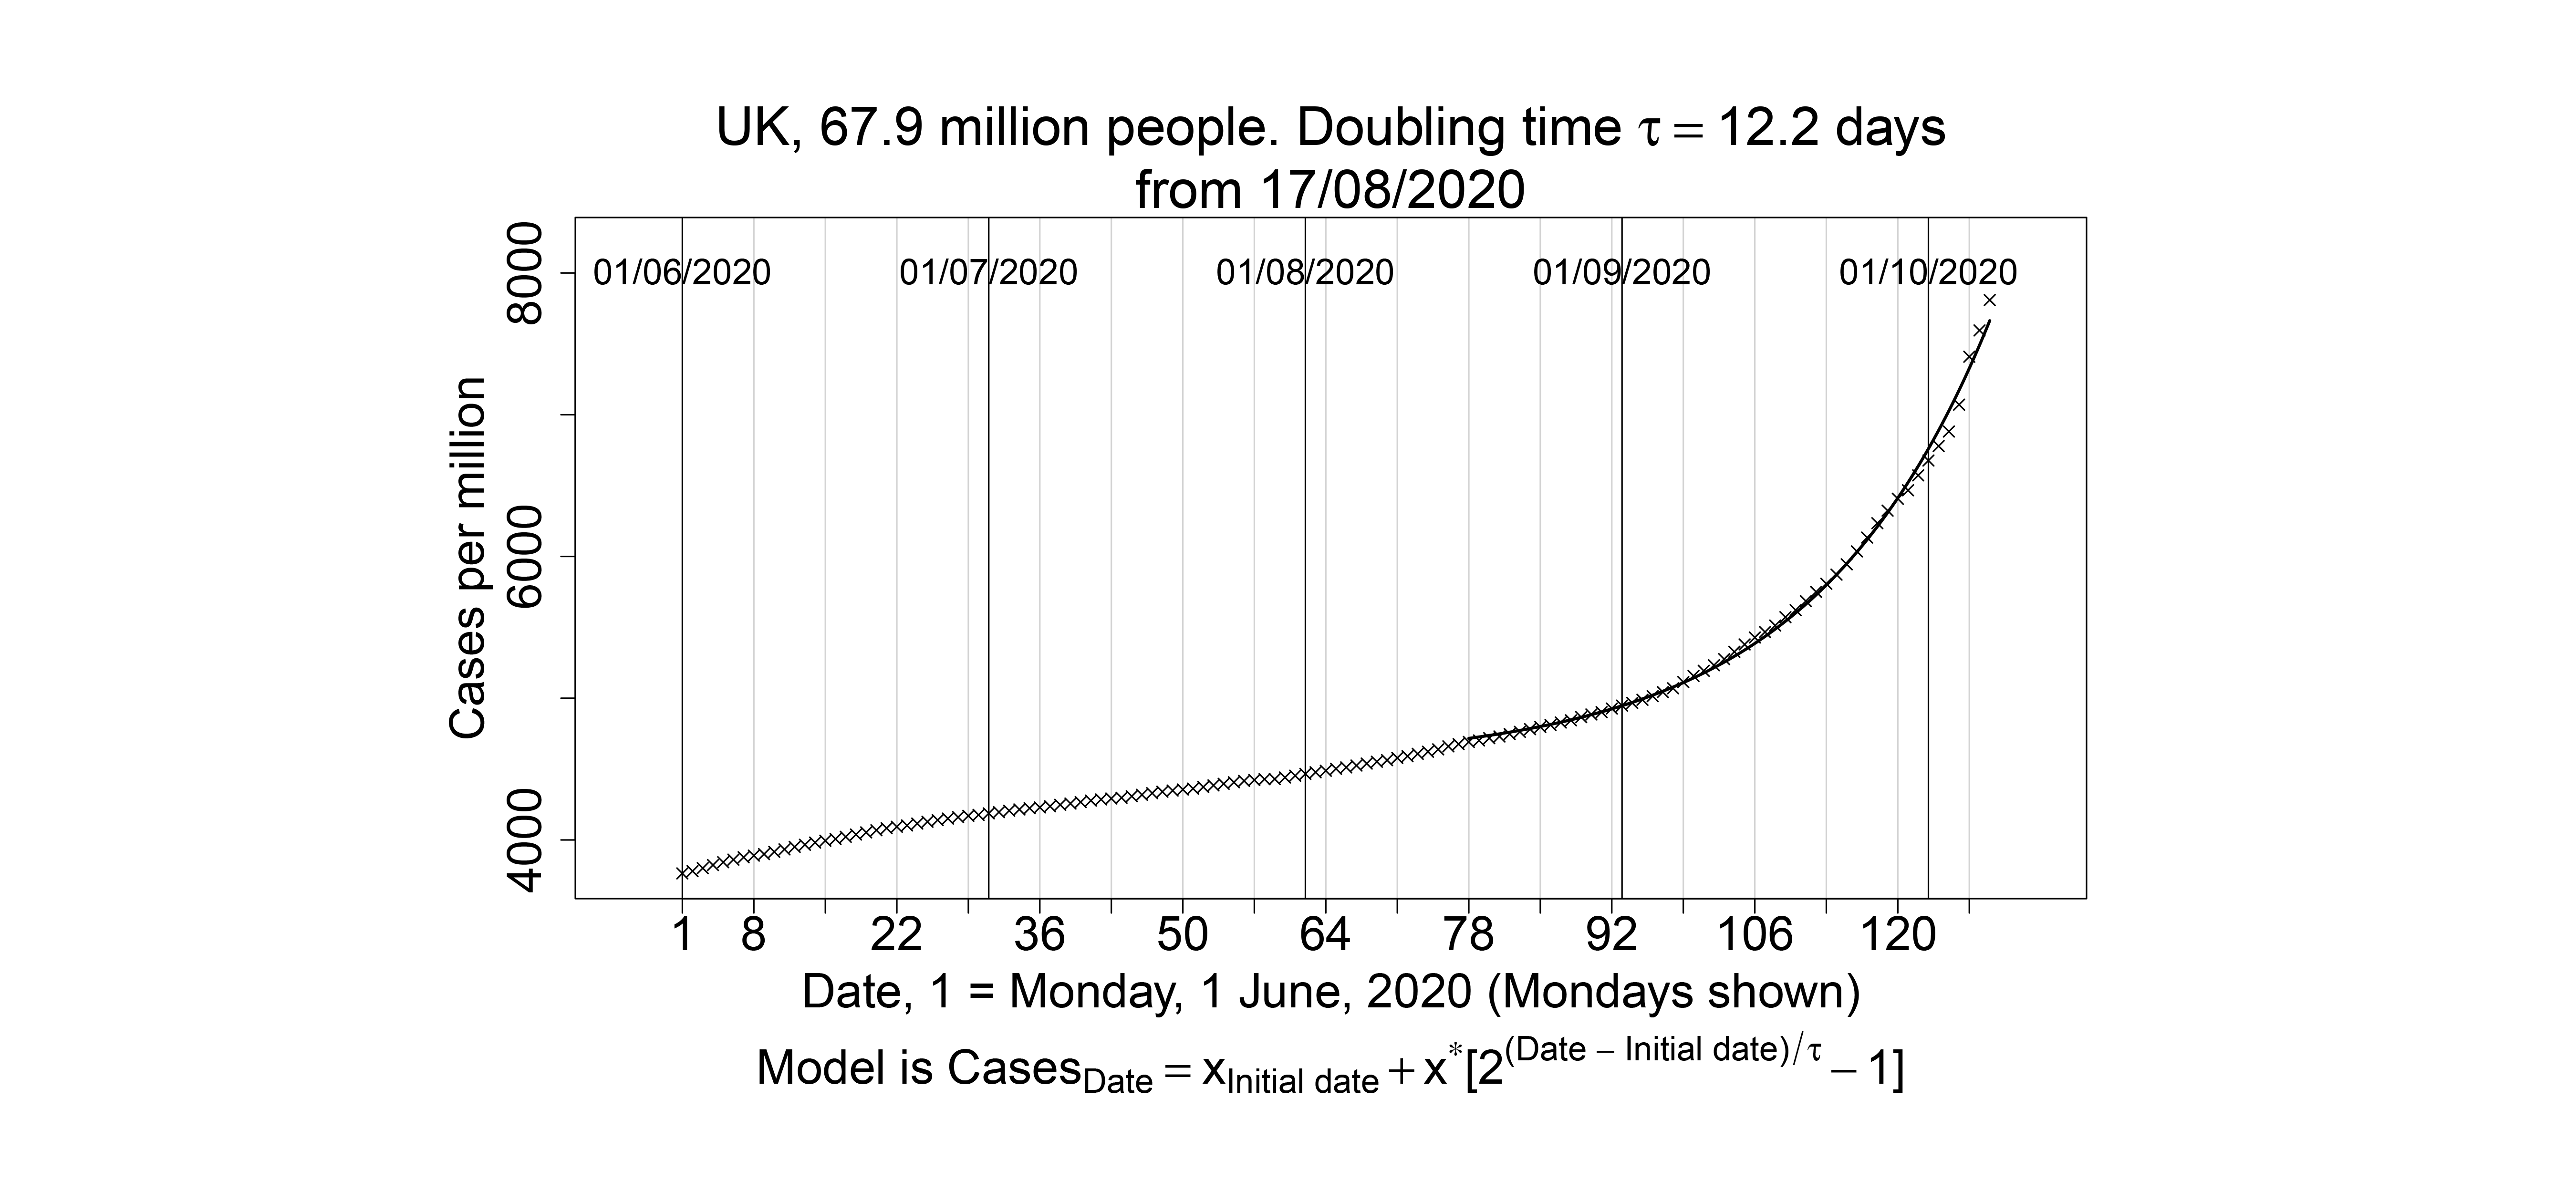
Figure 1: The number of documented cases of Covid-19 per million people in the UK plotted against day starting from 1 June. Mondays and the first day of each month are shown. A vertically shifted exponential growth model has been fitted from 17 August. We obtained data from here.
Some suggestions
In order to minimize the risk that the virus spreads into schools, one should reduce the probability that people who have the virus enter these establishments. Anyone who may have been in contact with a person who has tested positive for Covid-19 should get tested and, if possible, stay at home while awaiting the result. They should always wear a mask in school. This is especially important when someone from the same household is infected, as it has been estimated that the probability that one can become infected from another household member is around 0.42.
Another useful action that would help is for everyone to take their body temperature each day, under the same conditions, with increases in temperature over several consecutive days being reported to a medical professional. Teachers could record pupils’ temperature at the start of the school day.
Face coverings
The use of face coverings in the classroom is highly likely to reduce the probability of infection. Although UK government guidelines state that “face coverings would have a negative impact on teaching and their use in the classroom should be avoided”, a possible compromise is illustrated in Figure 2, where pupils wearing masks are indicated by white circles. The pupils who wear masks could then be alternated regularly. This halves the time that any pupil would have to wear a mask in the classroom, and doubles the distance between pupils not wearing masks. Pupils should be made fully aware of how this can be done in the safest way possible, following the Do’s and Don’ts suggested by the World Health Organization.
Of course, this requires the co-operation of pupils and possibly training for teaching staff. The classroom air should be changed regularly, even on cold days. Ideally, a doctor should periodically review the situation in each school.

Figure 2: A possible seating scheme for pupils. Pupils wearing masks are indicated by the white circles.
The advantage of bubbles
The spread of Covid-19 is reduced by the use of “bubbles”, especially if these mean that entrance to school, recreation times and the use of toilets is staggered as much as possible. Bubbles also make the management of any outbreak less difficult. To understand this more precisely, we will illustrate that the expected value of the number of daily infections in a school of K classes can be reduced by at least a factor of K, if the classes remain separated. The expected number of daily infections in a class can be approximated by multiplying the probability that a pupil is infected by the probability that an infected person infects a non-infected person, and then by the number of possible ordered pairs of pupils.
To understand this more precisely, let’s consider a bubble comprising just three pupils – a, b and c. Now, let’s assume that one of those pupils comes to school with Covid-19, but that the other two are healthy. If the infected pupil is a, then during the day s/he can infect b or c; similarly, if it’s b, then s/he can infect a and b, and if it’s c, then s/he can infect a and b. This means that there are six possible ‘infected to non-infected’ pairs: (a, b) (a, c), (b, a), (b, c), (c, a) and (c, b). So, the number of infections that we can expect at the end of the day depends on the number of connections in either direction that we can make between pupils. This is illustrated further in Figure 3 where we see a school of 12 pupils split into 3 bubbles of 4 pupils, each represented by a dot. In each bubble there are 12 connections (that is, 6 multiplied by 2, remembering that each connection is considered in either direction), so that there are 36 possible connections in this school. In Figure 4, the same school is no longer divided into bubbles. There are now 132 connections. We can therefore see that the number of connections has reduced by a factor of 132 / 36 or 3.67. In general, it can be shown that the number of connections, and hence the expected number of infections, is reduced by a factor that is at least the number of bubbles used; in our example K = 3. Underlying this argument is the assumption that the probability of infection is the same during a recreational break as it is during the longer in-class period where social distancing is more strictly respected. The same argument also applies to K bubbles, when each of them comprises more than one class.
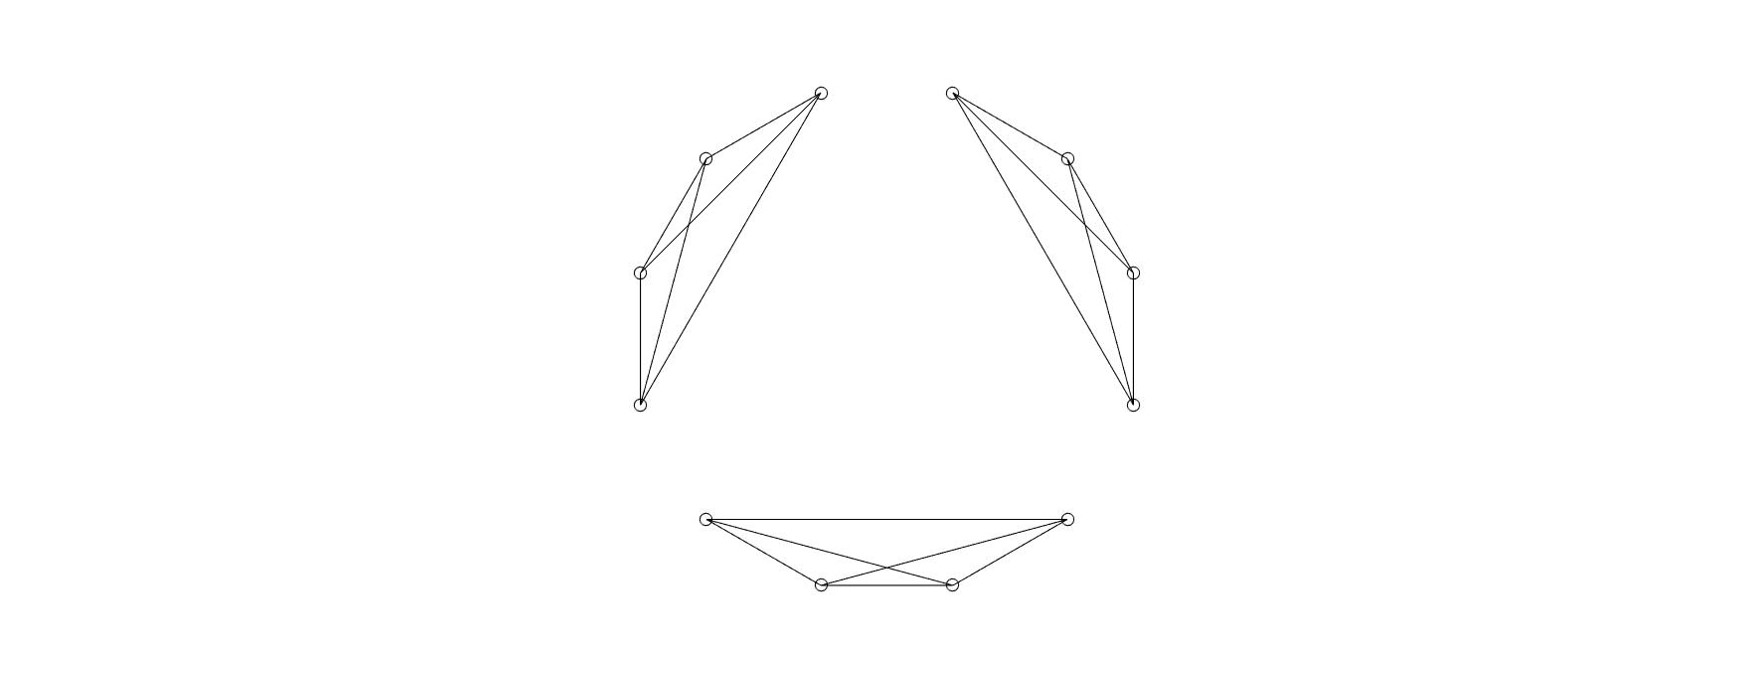
Figure 3: A school of 12 pupils, each of whom is represented by a dot, divided into 3 bubbles each of size 4. The lines between dots represent possible infection routes.
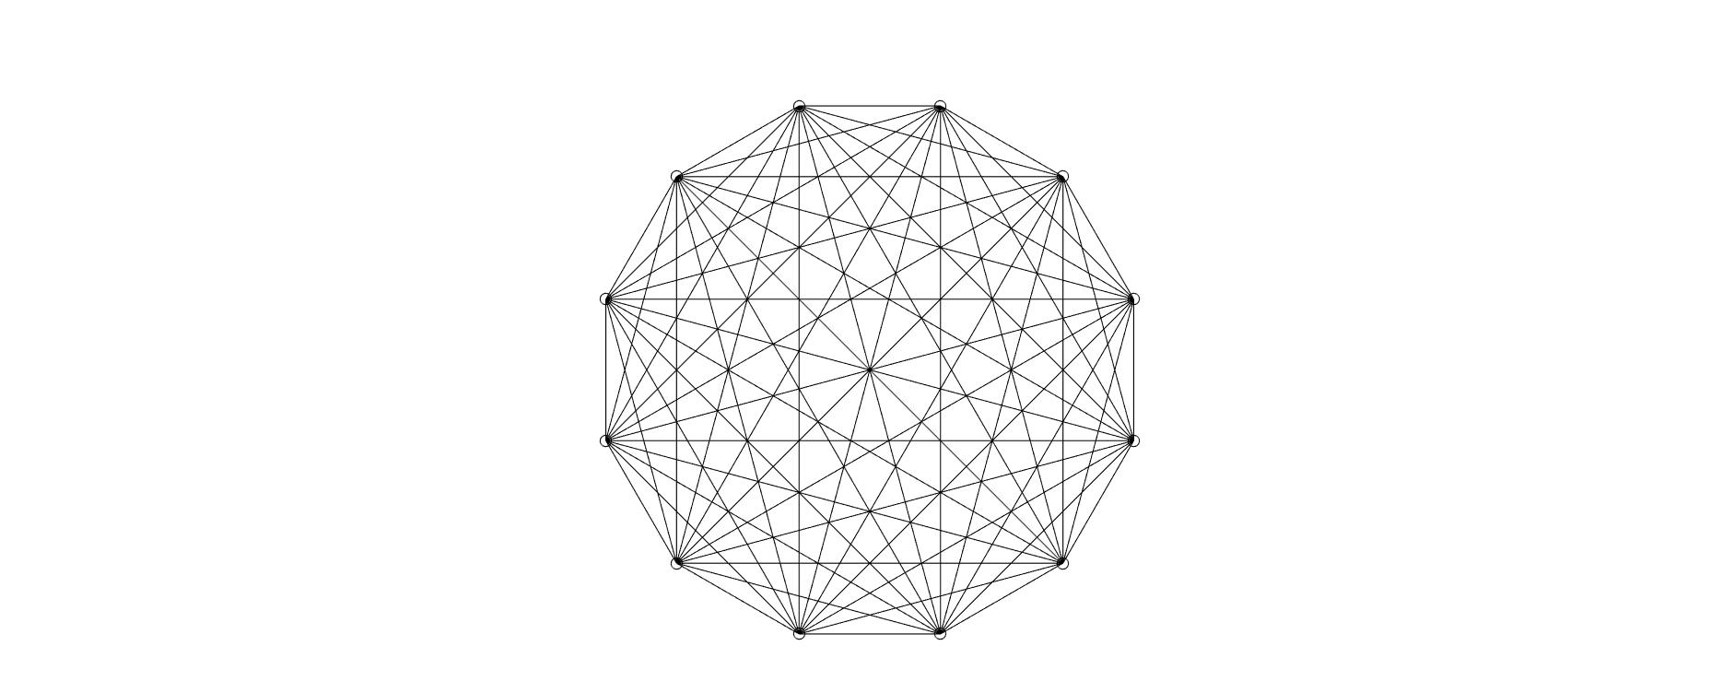
Figure 4: The same school as in Figure 3, without bubbles.
Group testing
We also recommend the use of routine testing in schools. This can be performed in a way that does not require every pupil to be tested separately. For example, all pupils in a group can be tested together, and, if a positive result is obtained, pupils can then be tested separately. Group testing would also be useful in the context of university students.
As a simple example, let’s consider students labelled 1 to 6 who live together in student accommodation. As shown in Figure 5, they could be divided into four groups of three so that each student appears in exactly two groups: Group A with 1, 2 and 4; B with 1, 3 and 5; C with 2, 3 and 6; and D with 4, 5 and 6. If only Groups A and B test positive, then student 1 is certainly the only possible case, as the remaining students do not cause the other groups to test positive. If A, B and C are positive, then the cases may be 1, 2 and 3, with 4, 5 and 6 in the clear because Group D does not test positive. In general, considerable savings can result, especially when the fraction of those who are infected is low. Further discussion about the use of “group testing” or “pooling” can be found in Significance and also in Nature, Science Advances, and a DELVE report.
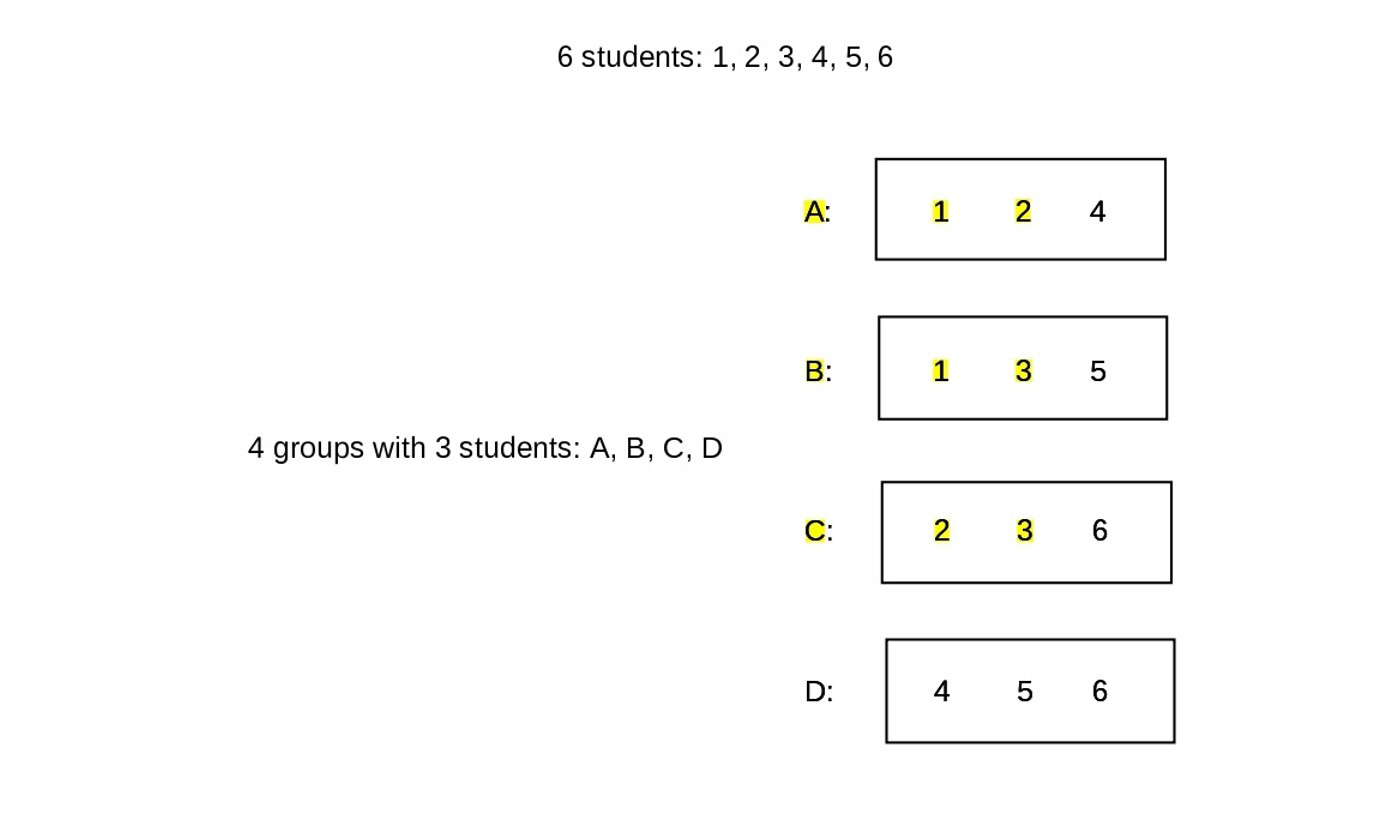
Figure 5: Six students divided into four groups for testing. If Groups A, B and C, but not D test positive, then students 1, 2 and 3 (highlighted) may be infected, but not students 4, 5 and 6.
Finally, we remark that we all need to continue to be aware of the importance of remaining vigilant and of acting quickly. Experiences from earlier in 2020 illustrate the consequence of delay or complacency. Figure 1 illustrates that the UK is in a phase of exponential growth in the number of documented cases of Covid-19. Figure 6 presents daily numbers of documented cases of Covid-19 per 100,000 people in France, Germany, Italy, Spain and the UK. The increase in cases since August is alarming in France, Spain and the UK (although there seems to be some recent improvement in Spain and France), and is much stronger than in Germany and Italy.
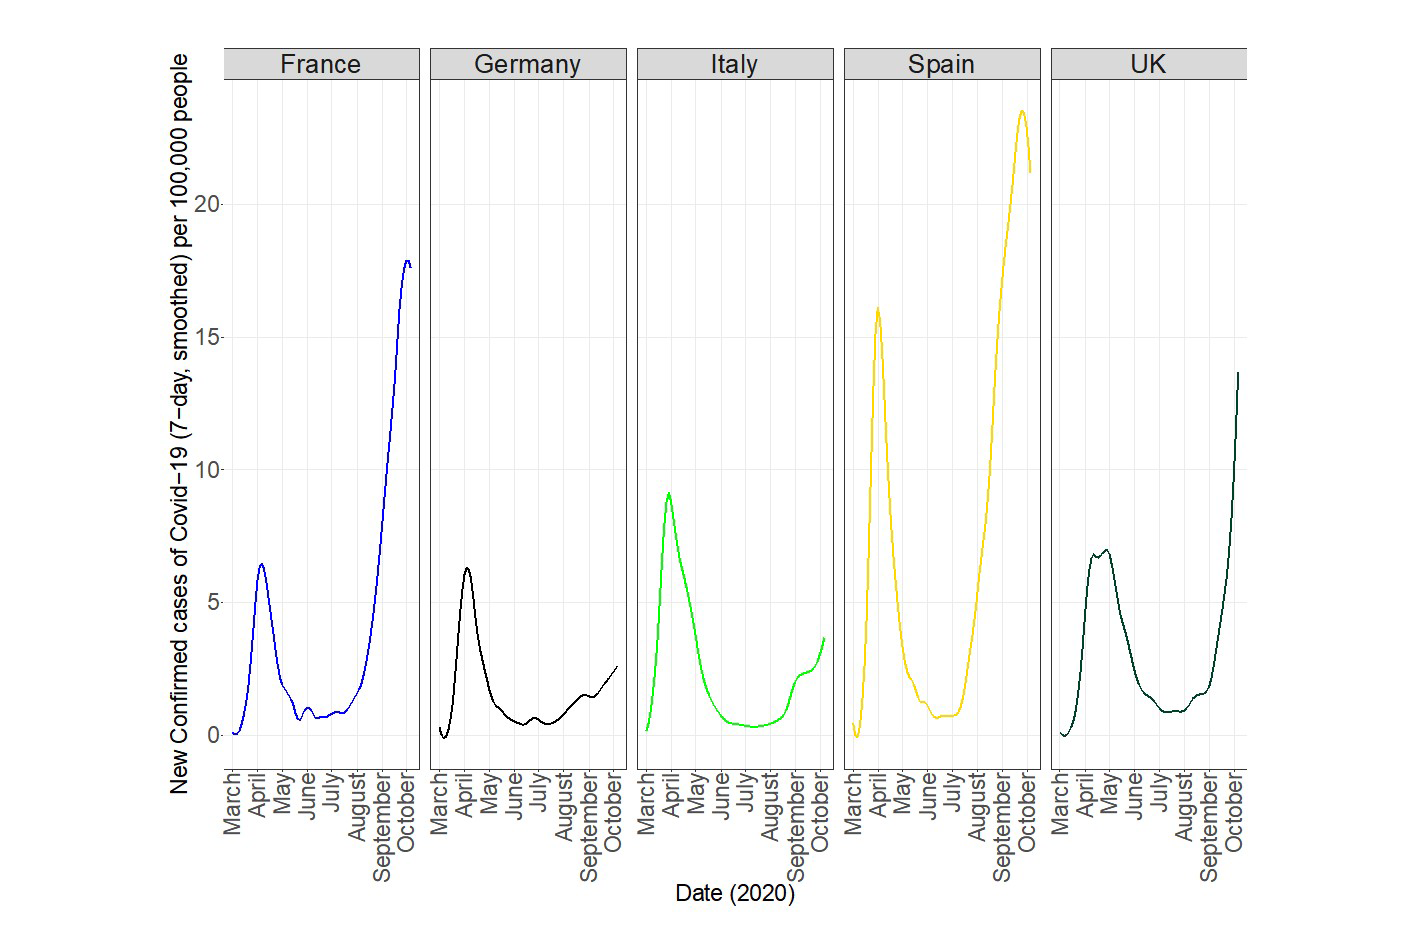
Figure 6: The daily number of documented cases of Covid-19 per 100,000 people in France, Germany, Italy, Spain and the UK.
Acknowledgement
We are grateful to Daniela Antonelli, Mario Cortina Borja and Brian Tarran for useful discussions and help in the preparation of this article.
About the authors
Giovanni Sebastiani is senior researcher at the Istituto per le Applicazioni del Calcolo “M. Picone” of the Italian National Research Council. He develops statistical and physical models for medicine, seismology and medical imaging.
Julian Stander is associate professor in mathematics and statistics, Centre for Mathematical Sciences, University of Plymouth. He develops statistical methodology for a range of application areas and is also interested in statistical education.


.png?sfvrsn=cb3153cf_11)