This design essay is about the creation of two graphics for the October issue of Significance. You can read the original article and get lost in giant versions of both graphics here.
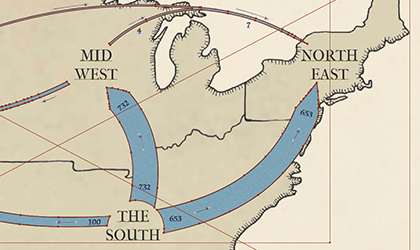
The Great Migration was the movement of over six million African-Americans out of the rural Southern United States to the urban Northeast, Midwest and West – possibly the largest peacetime migration in history. This essay details how US Census data was elevated to show this migration by mimicking the style of Charles Joseph Minard, 19th century thematic mapping pioneer.
Enter Howard Wainer
The history of data visualization has me hooked. The ingenuity, beauty, and stories behind each information graphic milestone fill me with awe. In the course of evangelizing my learnings, especially through a bespoke interactive, I have been able to connect with other fans of information graphics history, and even a few real historians.
Fans of data visualization history may know Howard Wainer as the force that brought us the re-publication of Playfair (my favorite dataViz book), the translation of Bertin’s Semiology of Graphics, or the last thoughts by Tukey on the craft.
Howard has also written many books that present some of the most convincing (and inspiring) data storytelling examples. All these publications are on top of a decorated career as a practitioner and educator.
So this incomplete introduction is my way of saying how delighted I was when Howard reached out to tell me he had an idea and wondered if I was open to a collaborating on a paper. It was an easy yes.
The idea: Howard was hot off successfully re-introducing us all to W.E.B. DuBois’s handmade charts and thought there was even more to tell. Here’s the initial pitch that got me on board:
Du Bois’ work shown in Paris in 1900 missed a great deal (obviously) of what was to come. The civil rights movement grew massively during WWI when lots of southern Blacks traveled to NY to join up with what became the “Harlem Hell Fighters” who distinguished themselves at Verdun, only to return to the US to racism, Jim Crow, the Klan, lynchings and the huge race riots of 1920s. This led to the Black diaspora to the north and eventually to the civil rights movement of the 60s. It would be a dramatic demonstration to show the diaspora as a Minard flow map (or a sequence of such maps).
And just like that our adventure had begun.


