

Leicester made demographic history as the first city in England where the Black, Asian and Minority Ethnic (BAME) community is the majority. And it is making history as the first city in England to re-enter lockdown after a surge in persons testing positive for SARS-CoV-2. Can Leicester turn this reversal into a triumph for local public health by rigorously documenting its SARS-CoV-2 transmission networks, and by using investigatory scientific methods to make new discoveries about asymptomatic infections and infectiousness? These are testing times.
Why was Leicester re-locked?
Leicester re-entered lockdown on 29 June after a spike in coronavirus cases. Provoked and perplexed, the mayor of Leicester and local public health teams were apparently unaware of the city’s 873 SARS-CoV-2 positive cases identified between 11 and 24 June through Pillar 2 of the UK government’s Covid-19 testing strategy – this being the “swab testing for the wider population”. Leicester’s Pillar 2 positives were 12 times its 71 known Pillar 1 positives – with Pillar 1 relating to swab testing in Public Health England (PHE) laboratories and NHS hospitals for those with a clinical need, and for health and care workers.
Failure of communication may have occurred because the NHS Test and Trace service, the Department of Health and Social Care (DHSC) statisticians and PHE were struggling valiantly to sort out data-sharing proprieties and to differentiate persons-tested from repeat tests on the same person. DHSC’s report on week 4 of Test and Trace shows that enormous progress has been made – but perhaps not in time to have prevented a serious lapse in communication with Leicester. I say “serious”, because communication delays risk hampering local responses to contain transmission and avert Covid-19 fatalities.
Let’s briefly review the reasons for re-locking before considering how we can all learn from Leicester’s response.
First, Leicester’s daily number of Pillar 2 Covid-19 cases doubled during 11–24 June versus the preceding two weeks. At least half the positive cases with known ethnicity were BAME (see page 14 of this PHE report), consistent with Leicester’s demography. And, reading off a graph, the 873 Pillar 2 positives during 11–24 June were young: 150 under 18 years; 640 aged 18-64 years; only 40 aged 65+ years. Hence, despite notable inter-generational living in Leicester, senior citizens are under-represented. Gender split was close to 50:50.
How many folk in Leicester were tested via Pillars 1 and 2 to generate the 71 + 873 = 944 positives in 11–24 June? Figure 1.1 of PHE’s report shows Leicester’s daily confirmed Covid-19 cases by specimen date, separately for Pillar 1 and Pillar 2, but omits information on persons tested. For England, Test and Trace explains that, during 11–24 June, just over 619,000 were tested in Pillars 1 and 2, of whom 11,430 were positive (1.8%).
My guesstimate from Figure 1.3 in PHE’s report is that around 3,500 Pillar 1 and 2 tests were done in Leicester during 11–24 June, 944 (27%) being positive.
Leicester’s population of 355,000 means that, on Test and Trace’s all-England basis, we’d have expected around 3,920 persons to have been tested within Pillars 1 and 2. Hence, despite Leicester’s array of “complex” cases of Covid-19 (including 6 nurseries, 4 workplaces, 3 care-homes and 2 schools) and recent doubling in confirmed Covid-positive cases, no increase in, or exuberance for, testing was apparent as an immediate Trumpian explanation for Leicester’s high positivity rate.
Leicester’s citizens were not exceptional in their Covid-test-seeking behaviour but are apparently outlying in their high test-positive rate
PHE’s “Preliminary investigation of Covid-19 exceedances in Leicester” included various comparisons per 100,000 of population, but it left me cold because test-seeking behaviour was not explicitly addressed other than in Figure 1.3. Figures 2.2-4 compared % of tests (not persons) with positive results in Leicester versus East Midlands from week 11 to week 26.
No funnel plots were presented – say, for local authorities’ case-counts (1–24 June) per 100,000 population,1,2 from which it would be easy to assimilate how many local authorities were outside of the funnel, and how far outside. Instead, top 10 tables were presented, for example, for case counts versus expectation, or comparisons focused on local authorities which were “close” to Leicester in some demographical, geographical or epidemiological sense that was not defined.
Test-seeking behaviour might, of course, contribute to PHE’s “exceedance algorithm”, but the statistical credential of, and inputs to, this “black box” were also unexplained.
There needs to be transparency – especially if this “exceedance algorithm” contributes to putting Leeds, Barnsley and Kirklees on someone’s watchlist. Pearls of wisdom from league tables, by their allure, can distract from the perils of league tables.
Timeliness matters in Test and Trace, and so it is essential to get local public health teams on-side and geared-up at an early alert level – not on the eve of lockdown. Hence, per index case, time intervals that matter for local public health teams’ engagement in Test and Trace are from the onset-time of key symptom to RT-PCR positive-result reported back to index case, to index case being referred to Test and Trace, to decision that index case is deemed “complex” and should be managed locally, to local public health team receiving contact-details for this “complex” index case. Leaving local public health teams uninformed about non-complex index cases in their jurisdiction would clearly be a mistake.
Leicester can write Test and Trace into public health history
As England’s first re-locked city, Leicester has the opportunity to write the public health account of how their city fell back into lockdown and its triumphal re-emergence.
Methodology matters: not just shaded maps showing Covid-19 case numbers with symbols denoting “complex contexts” (see Figure 1). For each such context, it is important to know: what was Leicester’s investigational plan, how it was delivered, what was discovered, what harm-reduction measures ensued, and which insights are likely to translate to other settings?
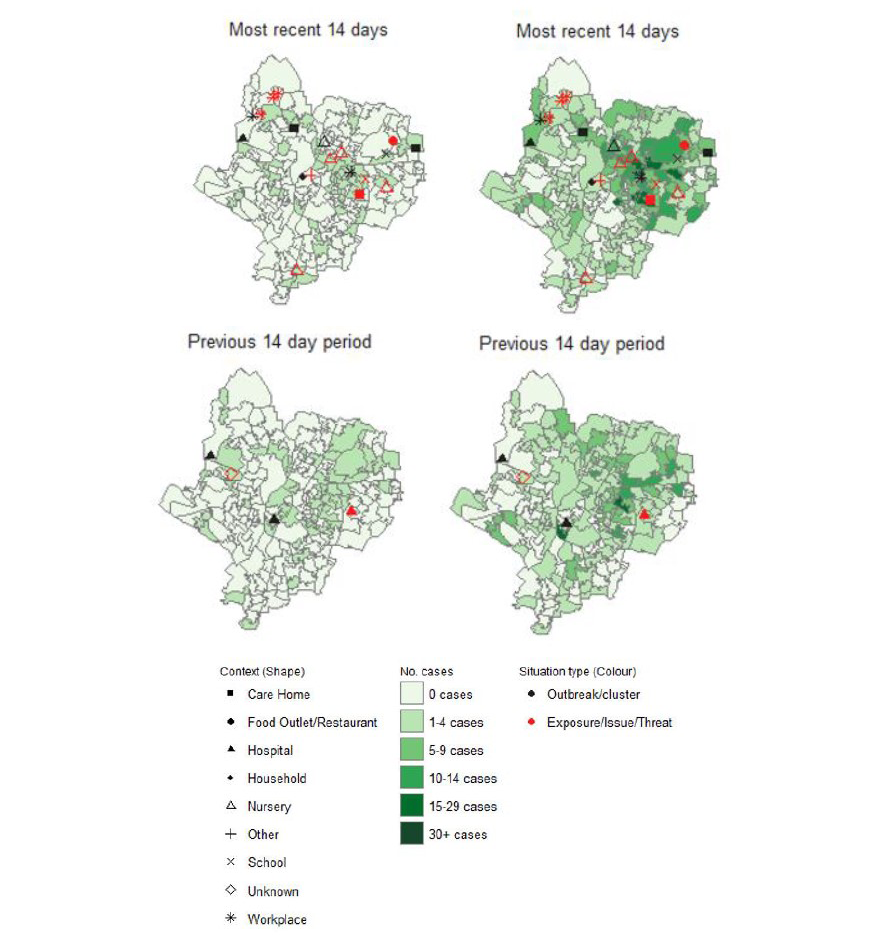
Figure 1: From PHE’s Leicester report: “Figure 1.10. Map of new cases reported from Pillar 1 (left) and Pillar 2 (right) in Leicester in recent 14 days (June 11 2020 to June 24 2020) and prior 14 days (May 28 2020 to June 10 2020), overlaid with outbreak/cluster information from HPZone”.
Test and Trace holds key information on swab-positive persons in Leicester, including those not referred to Test and Trace. Leicester’s public health team should investigate those non-referrals. We’d all like to know.
Understanding transmission networks goes well beyond mapping the geographical location of cases. The immense value and potential of the data collated within Test and Trace can only be unlocked when mapping extends to descriptions of networks: index case A met B in locations L1, L2, L3; A identified B as close contact but did not identify C. Subsequently, C tests positive for Covid-19 and identifies A as having been a close contact in location L2. Location L2, a workplace for clothing manufacture, features also in the Test and Trace accounts of E and F… Readers can begin to imagine how the network expands, including outside of the lockdown area, and the scientific method needed to encompass it.
During its re-lock and emergence, Leicester’s local public health team should offer additional swab-testing (on one or two randomly but purposefully selected days) to a random sample of:
a) household members of index positive cases during their 14-day quarantine;
b) quarantined close contacts of index positive cases during their 14-day quarantine.
These random visits also allow quarantine-adherence to be checked, which Test and Trace currently overlooks. Comparing the above random swab-positive results with symptomatology at the time of random tests (and subsequently) allows documentation of asymptomatic infections.
For those who are not randomly selected, Leicester would document:
c) how many household members of non-complex index positive cases sought a swab-test during their 14-day quarantine; and how many of them tested positive for SARS-CoV-2;
d) how many quarantined close contacts of non-complex index positive cases sought a swab-test during their 14-day quarantine; and how many of them tested positive for SARS-CoV-2.
Up to now, Test and Trace has not reported on the Covid-positive rates during 14-day quarantine for other members of index cases’ own household or for quarantined close contacts – but it must do so urgently for all-England.
About the author
Sheila M. Bird is formerly programme leader at the MRC Biostatistics Unit, Cambridge University. She is a member of the Significance editorial board and the Royal Statistical Society’s Covid-19 Task Force. She writes here in a personal capacity.
Acknowledgement
Thanks to Geoffrey Hayward for the photograph that accompanies this article.
References
- Royal Statistical Society Working Party on Performance Monitoring in the Public Services (chair: Bird, S. M.) (2005) Performance indicators: good, bad, and ugly. Journal of the Royal Statistical Society, Series A, 168, 1–27. ^
- Spiegelhalter, D. J. (2005) Funnel plots for comparing instituional performance. Statistics in Medicine, 24, 1185–1202. ^


