

With Christmas approaching again, I thought I’d update the results and see if the trend continued. However, as is often the case when revisiting old work, I came across a few issues which cast some doubt on my original findings. If you’re interested in where things went wrong, you can skip to the end of the article. Otherwise, read on for the full analysis.
The analysis revisited
To say that Christmas is arriving earlier each year would suggest that people are starting to do Christmassy things earlier in the year; buying gifts, watching Christmas films, listening to Christmas songs, or decorating their houses. These days, our internet activity will tend to reflect our prevailing thoughts and feelings at any given time: we might share an update on Facebook, or search the web for whatever is on our mind.
Every time you enter a search on Google, a record is made of what was searched for and when. Google then makes this data publicly available through its Trends tool, which allows users to investigate the search history for whatever terms they might think of.
Search data are used for a variety of purposes. Google Flu Trends is perhaps the most famous example, though its attempts to predict flu outbreaks has had some well-documented ups and downs. More recently, Google Trends data were used to claim that searches for ‘what does the EU do?’ peaked following the Brexit vote, and, similarly, that searches in the US for ‘what does the president do?’ (see Figure 1) peaked just after it became clear that Donald Trump had won the 2016 election.
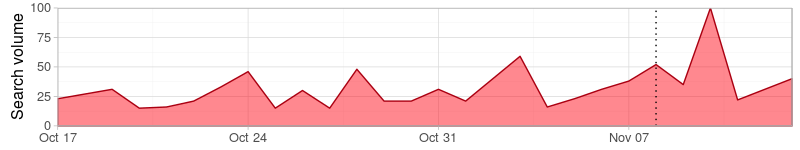
Figure 1. US search activity for ‘what does the president do?’, via Google Trends.
So, we can see that Google searches can be potentially illuminating on the prevailing thoughts and moods of the people making the searches. It therefore stands to reason that if people are feeling festive, they may be searching for festive items. A quick eyeballing of the data (Figure 2) confirms that search volume for a few Christmas-related terms is much greater around Christmas time.
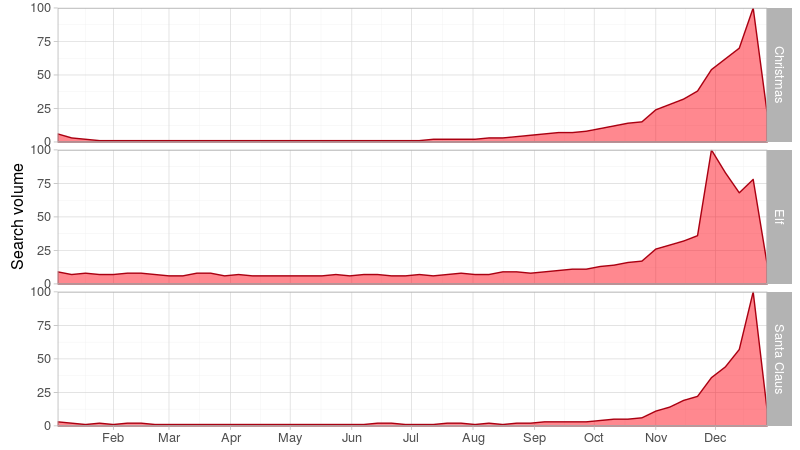
Figure 2. UK search activity for some Christmas-related terms.
With this in mind, I used Google Trends to see whether searches for Christmas-related terms start earlier each year. I attempted to select terms that were associated with Christmas, but which were not likely to be associated with other events. For example, ‘snow’ is a term that is associated with Christmas but not exclusively: if, by some chance, it snowed in July, people making searches related to ‘snow’ are unlikely to be revelling in the spirit of Christmas. In total, I selected just over 20 Christmassy terms, movies, characters, and songs (see box) and gathered weekly data on search activity for the years 2004-2015. In all cases, a week is defined as starting on Sunday, as opposed to whatever day of the week 1 January fell on. Although Google Trends provides daily data, these are only for prohibitively narrow windows, and due to the data being normalised within each time period it was infeasible to get a consistent series of the data.
| Christmas search terms Advent, Christmas, Christmas Tree, Elf, Santa Claus, Reindeer, Rudolph, Scrooge, Christmas Carol, Stocking, Miracle on 34th Street, Grinch, Jingle Bells, Silent Night, Mistletoe, Sleigh, White Christmas, Home Alone, Mulled Wine, Bad Santa, Love Actually, It’s a Wonderful Life, Jingle All the Way. |
With the necessary data to hand, I set about dividing each of the years into two distinct groupings: the Christmas period, and the rest of the year, with the groupings determined according to the volume of search activity for my Christmas-related terms. The standard approach for identifying different groups within data is that of cluster analysis. More specifically, in this case I used constrained model-based cluster analysis. To explain:
- Cluster analysis is a group of statistical techniques which aims to uncover a group structure in data wherein observations assigned to a group are more similar to each other than to observations in other groups.
- Model-based cluster analysis attempts to uncover these groups by assuming that each of the groups is defined by a distinct statistical model. In this case our data are discrete counts, so we can assume that our data arise from a Poisson distribution with a distinct lambda parameter for each group, meaning the groups will have a different mean number of searches per week.
- Constrained model-based cluster analysis imposes some restrictions on how the clusters can be formed. Typically this is done so as to incorporate some knowledge we may have of how the clusters should be formed. In our case, we know that the clusters must be formed of contiguous periods of time – once the Christmas period begins, it tends to not stop until it has fully run its course. As such, we impose the constraint that if any two weeks are assigned to a cluster, then all intervening weeks must also be assigned to that cluster.
Model-based clustering algorithms aim to find the cluster allocation with the greatest likelihood given the observed data. Typically, however, finding an optimal solution can be complicated by the number of possible clustering allocations; for a fixed number of clusters the number of ways of partitioning N observations into k clusters is what’s known as a Stirling number of the second kind. Even in this simple scenario, where we have just 52 observations (one for each week of the year) and we are looking to find just two clusters, there are over 2 quadrillion possible ways of doing this. It’s infeasible to consider every single allocation, so clever approaches involving data augmentation and statistical techniques, such as the expectation-maximisation algorithm, are used to find an optimal cluster allocation. Luckily, as well as making sense contextually, the constraint mentioned earlier drastically reduces the number of possible allocations to just the number of ways you can select (k – 1) items from (N – 1) items. To understand this, note that the first cluster will always begin at observation 1, and then finding an allocation is just finding a place among the (N – 1) remaining observations for the (k – 1) clusters to begin. What this means is that, in our case, there are just 51 possible allocations to consider (or just 45, in fact, as I discarded the first six weeks of each year in order to ensure the results weren’t influenced by a residual ‘Christmas hangover’ at the beginning of each year). Using the statistical package R, I compared the likelihood for each possible clustering, defining the Christmas period as that defined by the cluster allocation with the maximum likelihood. This process was repeated for each of the years 2004-2015.
The results (Figure 3 and Table 1) appear to lend some credibility to the claim that Christmas is starting earlier now than in previous years. There does appear to be a slight tendency towards Christmas beginning at earlier periods in the year, with the festive season kicking off the week beginning 21 November in 2004, and on 8 November in 2015. However, there doesn’t seem to be a consistent trend within the years, and given the weekly nature of the data, many of the years can’t be differentiated; it should be noted that the linear trend from 2009 to 2015 is caused by the weekly nature of the data as, in each case, the finding is that the Christmas season begins on the Sunday at the end of the second week in November.
Even if we were to definitively claim the existence of a trend, it should be noted that patterns in the data may reflect the changing demographics of internet users for the period in question. There might well be a cohort of people who have always prepared for Christmas far in advance, and that these people – over time – have started doing more of their preparation online than they have done in the past. This would make it seem as if Christmas was coming earlier based on Google search data, despite there being no underlying shift in when people start feeling festive.
Similarly, trends in the data might simply reflect changes in the way we consume media. Previously, when we wanted to watch a Christmas film or listen to Christmas songs, we may not have relied on the internet at all. Nowadays, thanks to digital streaming services like Netflix, YouTube and Spotify, we access media much more frequently online. We can see evidence of this increase in digital consumption in another, more heuristic, attempt to predict the onset of the Christmas season. This approach looked at the increase in plays of Mariah Carey’s ‘All I Want for Christmas is You’ on YouTube. While the trend is reasonably consistent across years, the volume of plays around Christmas time has increased, arguably reflecting the change in our means of accessing music.
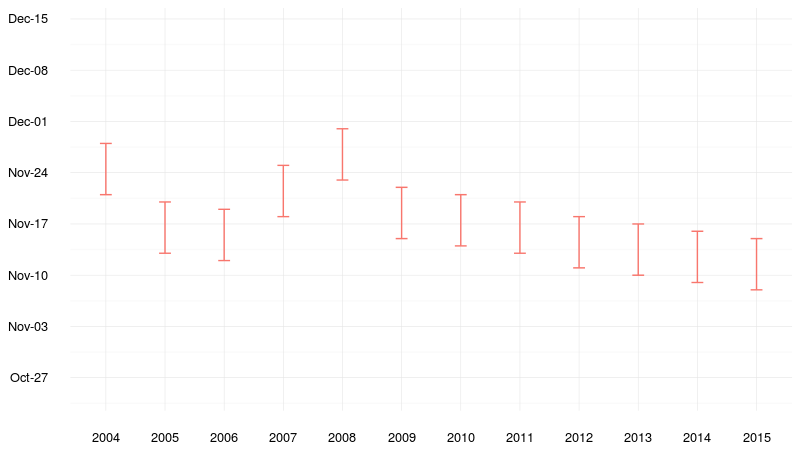
Figure 3. The inferred week in which search activity for Christmas-related terms became markedly different.
| Table 1. The dates when the Christmas period started, according to an analysis of Google Trends data. | |
| Year | Christmas began (week starting) |
|---|---|
| 2004 | 21 November |
| 2005 | 13 November |
| 2006 | 12 November |
| 2007 | 18 November |
| 2008 | 23 November |
| 2009 | 15 November |
| 2010 | 14 November |
| 2011 | 13 November |
| 2012 | 11 November |
| 2013 | 10 November |
| 2014 | 9 November |
| 2015 | 8 November |
Where things went wrong previously
For each of my selected Christmassy terms, I extracted the Google Trends data giving weekly search volume for the period 2004-2013. These data are processed prior to download – all data are normalised to a whole number between 0 and 100. What this effectively means is that any data below a certain threshold (0.5% of the maximum value across all years) will effectively be wiped out and will be indistinguishable from any period with lower search activity.
If average search volume is relatively constant across the years then this should not disproportionately affect any individual year. However, as search volume has tended to increase in later years, earlier years will be disproportionately affected by this normalisation process. In these years, lower values will appear as zeros as they fall below 0.5% of the maximum value in later years. Only the peak activity will remain – meaning that much of the buildup to Christmas will be indistinguishable from the rest of the year. Conversely, for later years, values for weeks much earlier in the year will still be present in the data, giving the impression that Christmas activity picks up much earlier – as early as August, as previously reported.
In order to mitigate the effects of this, in this reanalysis I downloaded each year’s data separately, rather than as a group of years. As such, the data can be compared among themselves and there is no cross-year comparison made prior to the analysis, so none of the years should be disproportionately affected by this normalisation.
- Nathan Cunningham, PhD, is lead data scientist working at the Centre for Intelligent Power with Eaton. He was a finalist in the 2014 Young Statisticians Writing Competition.


