

Cough, fever, and difficulty breathing are all symptoms for Covid-19, but symptoms alone may not qualify someone to be tested for SARS-CoV-2, the virus that causes Covid-19. In the US, only those individuals who meet stringent requirements, such as hospitalization with no other pathogen detected or exposure to an individual with Covid-19, are tested due to the shortage of testing resources. Shortages like this around the world have hampered efforts to understand Covid-19 and to prevent its spread, especially by asymptomatic individuals.
In similar situations where resources are in short supply, a procedure known as group testing (also known as pooled testing and specimen pooling) is often employed. Its most basic implementation begins by obtaining specimens from a set number of individuals and then pooling parts of each specimen into a “group” for a single test. If the group tests negative, all of its members are declared negative. If the group tests positive, each member has the remainder of their original specimen tested separately to determine the positive/negative outcome. This process of forming groups and testing is repeated over all individuals that need to be tested. Robert Dorfman originally proposed this particular testing algorithm to screen US soldiers for syphilis during World War II, and the process is often referred to now as “Dorfman testing”.1
When disease prevalence in a population is small (less than 15%), group testing results in a significant reduction in the number of tests performed. Group testing is used in a vast number of applications, including blood donation screening for infectious diseases, sexually transmitted disease detection,2 bacteria in food detection,3 and chemical compound discovery for use in new pharmaceuticals.4 Group testing was even investigated for the influenza pandemic (H1N1) of 2009.5
There are two important considerations for applying group testing. First, pooling specimens leads to each individual specimen being a smaller portion of the whole. This dilution could make it more difficult to detect the pathogen; thus, potentially producing false negatives. Second, a group size needs to be selected. Too large of a group size results in too many groups testing positive, leading to an exorbitant number of separate tests. Too small of a group size results in many more group tests than needed. To prevent this from occurring, the expected number of tests is used to determine the most efficient group size. In other words, we want the group size that gives the smallest average number of tests if group testing was applied to a continuous stream of specimens coming into a laboratory. Our sidebar presents the technical details for selecting this group size.
The Nebraska Public Health Laboratory has been a leader among laboratories with regards to applying group testing to detect SARS-CoV-2. Their positivity rate was estimated to be 5% from initially testing specimens separately. The most efficient group size for Dorfman testing is 5 with this rate, resulting in 57% fewer tests on average than testing specimens separately. Validation of the group testing process showed that pooling 5 specimens together did not adversely affect the detection of positive specimens with a low viral load. After six days of actual implementation, Dorfman testing resulted in 58% fewer tests than if the same number of individuals were tested separately. From another perspective, 137% more individuals were tested using the same resources as would be needed with separate testing.
Figure 1 illustrates the expected efficiency of Dorfman testing in general. The reduction in the expected number of tests grows as the disease prevalence decreases, leading to an increase in testing capacity. Especially of interest is the extremely large increase in testing capacity for very low disease prevalence. This would likely occur if the stringent requirements for individuals to be tested were lessened to allow for testing asymptomatic individuals. For example, the increase in expected testing capacity is 411% when disease prevalence is 1%.
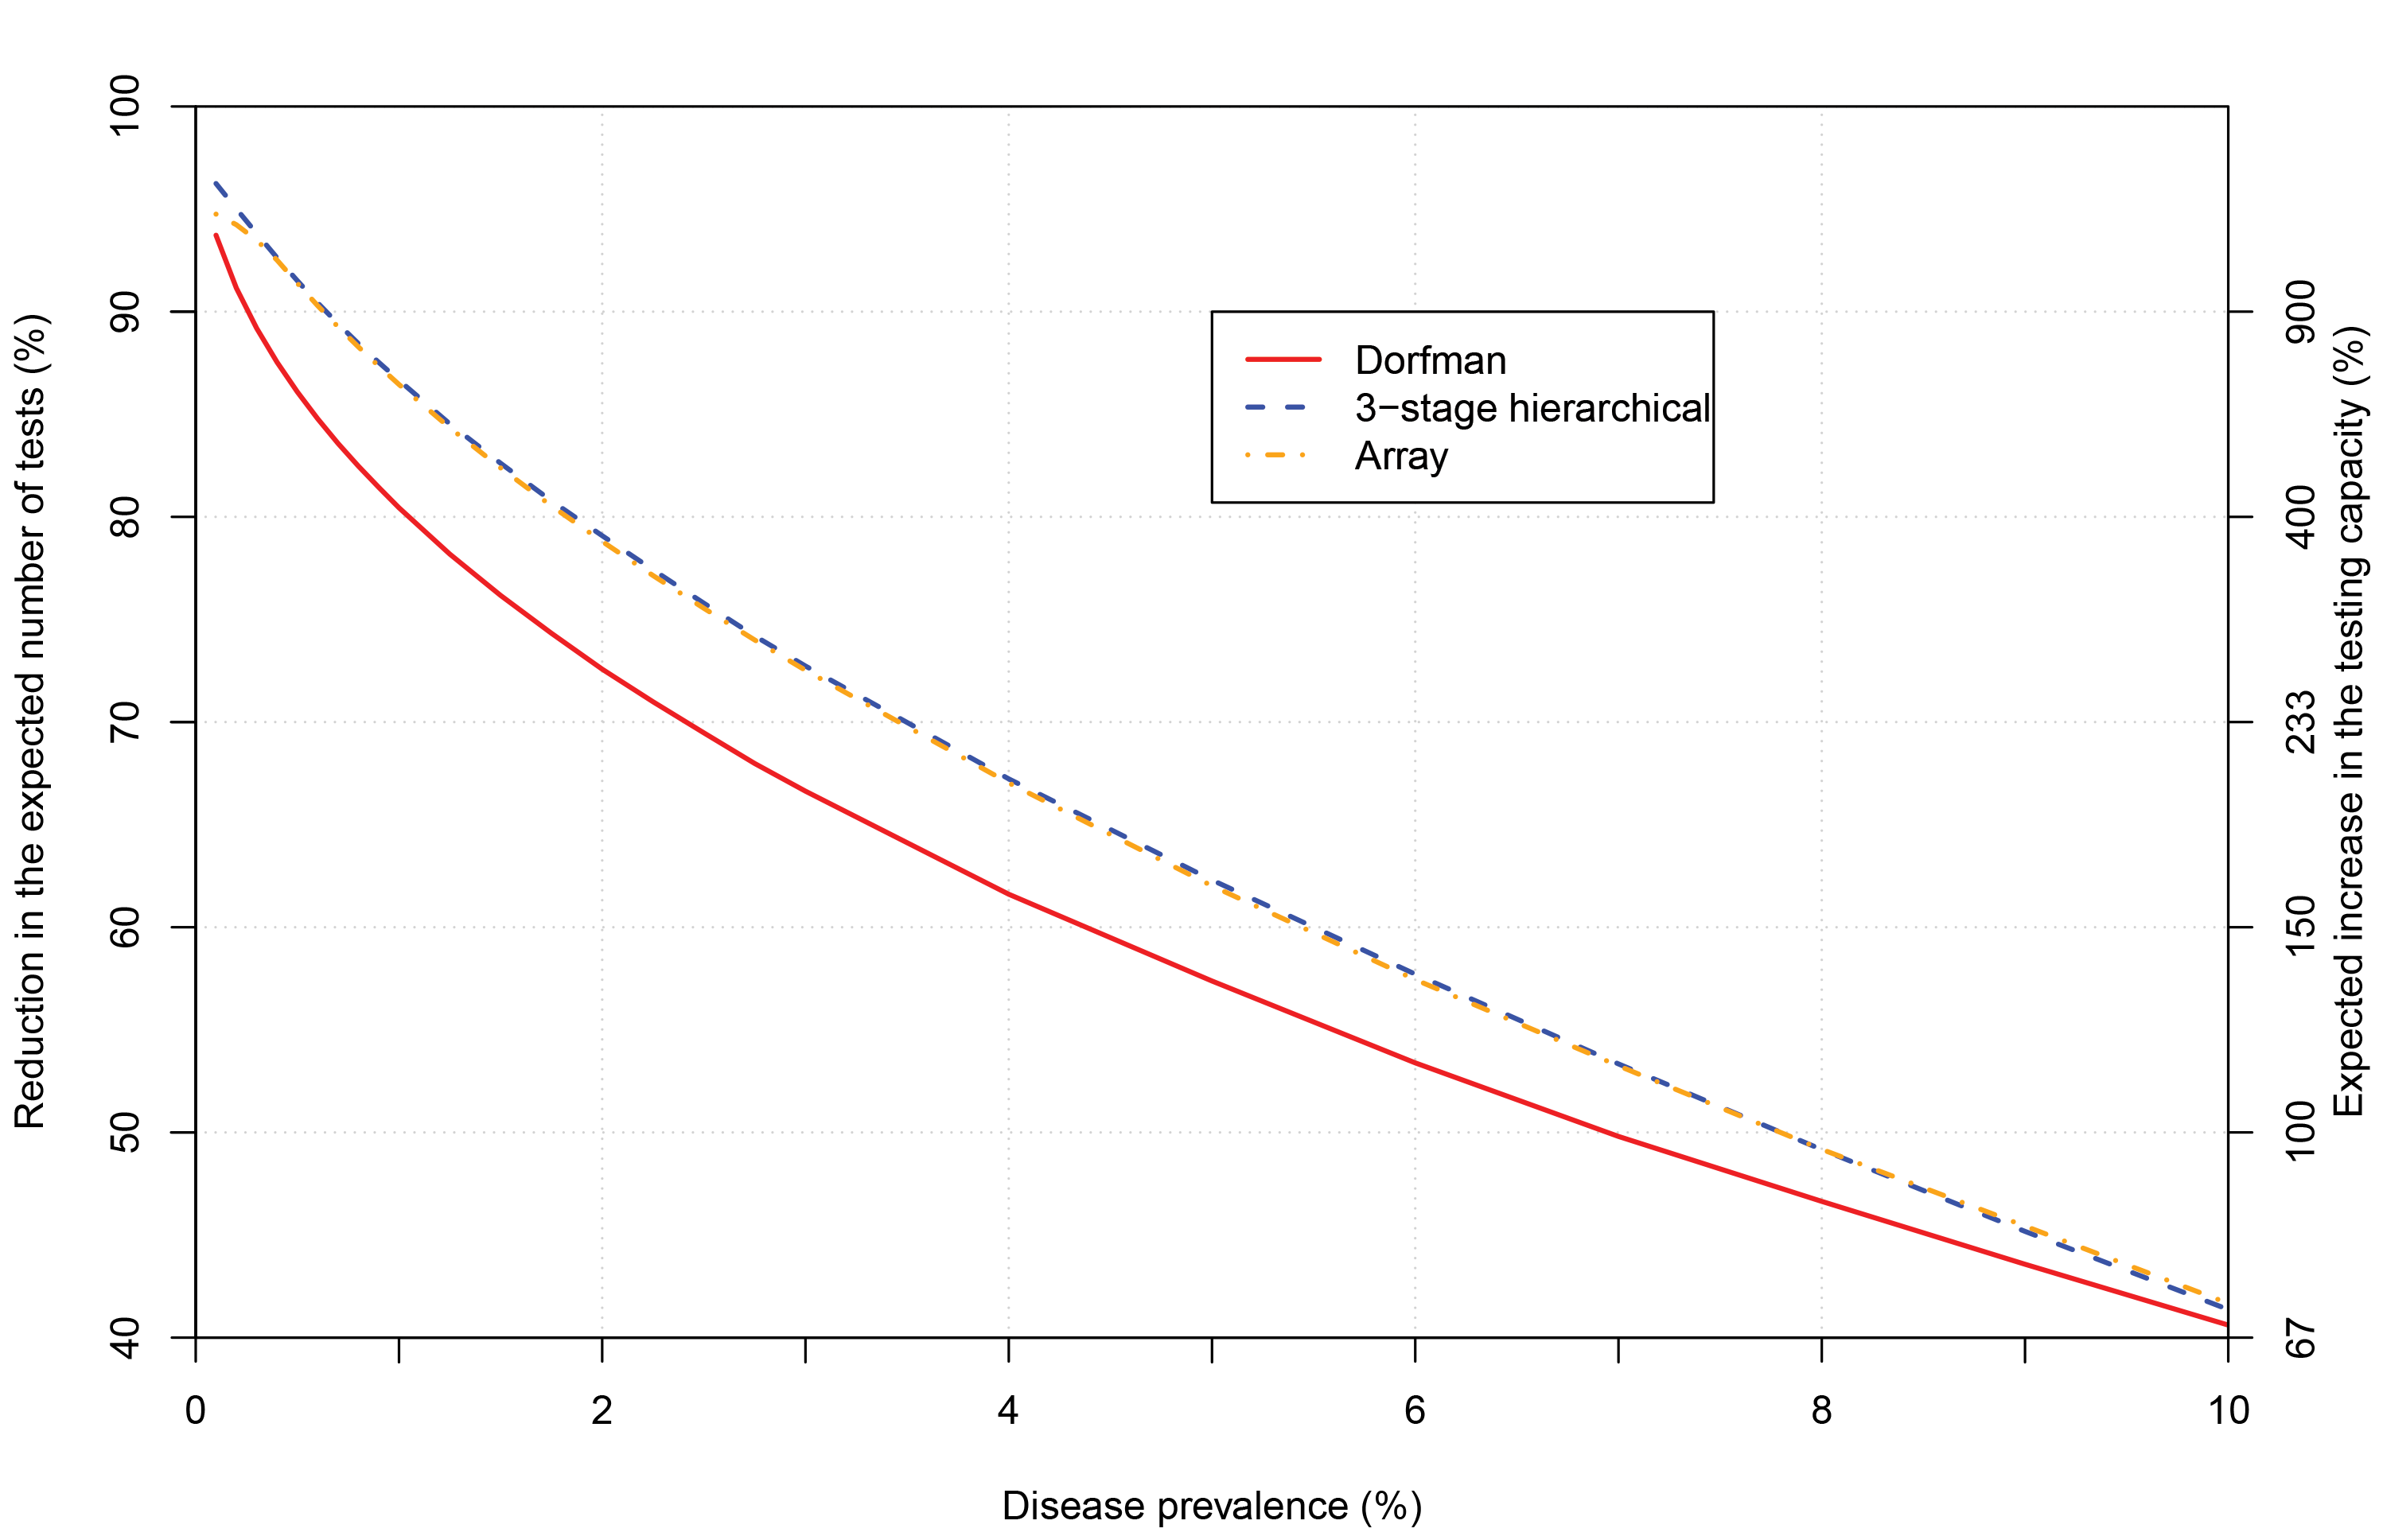
FIGURE 1 Reduction in the expected number of tests for group testing algorithms. Group sizes chosen are those that minimize the expected number of tests per individual at a particular disease prevalence and for a specific algorithm. The maximum group size allowed is 40. The right-side y-axis displays the expected increase in the testing capacity (see sidebar) relative to the tick marks on the left-side y-axis.
Other group testing algorithms can increase testing capacity even further. This occurs for three-stage hierarchical testing as shown in Figure 1. The algorithm is similar to Dorfman testing, but groups that test positive are split into subgroups for further testing. If any subgroup tests positive, each of its members is tested separately. Figure 1 also shows that array testing increases testing capacity further as well. This algorithm involves arranging specimens into a matrix-like structure, where specimens are pooled by rows and by columns to form groups. Those specimens at intersections of positive rows and columns are retested to determine disease outcome. Many other group testing algorithms exist, including those that take advantage of individual-specific probabilities of positivity to increase testing efficiency. Bilder (2019) provides introductions to these and other group testing algorithms.
Group testing is one component for solving our world’s testing problem. Still, more testing resources are needed. Group testing could also be used to estimate SARS-CoV-2 prevalence. When test accuracy is known, statistics research has shown that prevalence estimators based on group testing data have very similar variability to those obtained through testing each specimen separately.6 This counterintuitive result means that a smaller number of tests can be used without loss in efficiency for the estimator itself.
Sidebar
Define T as a random variable for the number of tests from a group of size s , and define G as a binary random variable indicating whether a group tests positive (1) or negative (0). The expected number of tests for a group using Dorfman testing is
E (T ) = 1 + sP (G = 1).
With perfect test accuracy, P (G = 1) = 1 – (1 – p)s, where p is the disease prevalence. The most efficient group size is the one that minimizes E (T )/s , the expected number of tests per individual for the group. Finucan7 showed that this minimum can be approximated by choosing the group size as the next integer larger than 1/√p , but one can also iterate over a range of group sizes to find the solution. In application, p is unknown, so an estimate is substituted.
Two measures of efficiency for group testing relative to testing specimens separately are:
- The percentage reduction in the expected number of tests: 100 (1 – E (T )/s )%
- The expected increase in the testing capacity: 100 {1/[E (T )/s ] – 1}%
Acknowledgements
This work was supported by Grant R01 AI121351 from the National Institutes of Health.
About the authors
Christopher R. Bilder is professor in the Department of Statistics at the University of Nebraska-Lincoln.
Peter C. Iwen is professor in the Department of Pathology and Microbiology at the University of Nebraska Medical Center and Director of the Nebraska Public Health Laboratory.
Baha Abdalhamid is assistant professor in the Department of Pathology and Microbiology at the University of Nebraska Medical Center and faculty scientist at the Nebraska Public Health Laboratory.
Joshua M. Tebbs is professor and chair of the Department of Statistics at the University of South Carolina.
Christopher S. McMahan is associate professor in the School of Mathematical and Statistical Sciences at Clemson University.
References
- Dorfman R. (1943) The detection of defective members of large populations. The Annals of Mathematical Statistics 14, 436-440. ^
- Lewis, J., Lockary, V., and Kobic, S. (2012) Cost savings and increased efficiency using a stratified specimen pooling strategy for Chlamydia trachomatis and Neisseria gonorrhoeae. Sexually Transmitted Diseases 39, 46-48. ^
- Græsbøll, K., Andresen, L., Halasa, T., and Toft, N. (2017) Opportunities and challenges when pooling milk samples using ELISA. Preventative Veterinary Medicine 139, 93-98. ^
- Salzer, E., Nixon, E., Drewes, G., Reinhard, F., Bergamini, G., and Rau, C. (2016) Screening pools of compounds against multiple endogenously expressed targets in a chemoproteomics binding assay. Journal of Laboratory Automation 21, 133-142. ^
- Van, T., Miller, J., Warshauer, D., Reisdorf, E., Jernigan, D., Humes, R., and Shult, P. (2012) Pooling nasopharyngeal/throat swab specimens to increase testing capacity for influenza viruses by PCR. Journal of Clinical Microbiology 50, 891-896. ^
- Liu, A., Liu, C., Zhang, Z., and Albert, P. (2012) Optimality of group testing in the presence of misclassification. Biometrika 99, 245-251. ^
- Finucan, H. (1964) The blood testing problem. Applied Statistics 13, 43-50. ^
Update
On 19 May 2020, a sentence in the Sidebar was corrected to read, “Finucan showed that this minimum can be approximated by choosing the group size as the next integer larger than 1/√p …”, instead of “larger than √p ” as stated previously.


