

Why is it important to communicate uncertainty in official statistics? A broad reason is that governments, firms and individuals use the statistics when making numerous decisions. The quality of these decisions may suffer, if those deciding incorrectly take reported statistics at face value or incorrectly forecast the magnitude of errors. If statistical agencies communicated this uncertainty, it would enable decision makers to better understand the information available regarding key economic variables.
When it comes to survey data, sampling error can be measured using established statistical principles to represent the whole population. The challenge is to satisfactorily measure non-sampling error, such as respondents giving inaccurate information. There are many sources of errors like this and there has been no consensus on how to accurately measure them.
To better understand these uncertainties, I find it useful to distinguish between transitory statistical uncertainty, permanent statistical uncertainty and conceptual uncertainty.
Transitory statistical uncertainty
This arises because data collection takes time. Agencies sometimes release a preliminary estimate of a statistic in an early stage of data collection, and then revise the estimate as new data arrives. Hence, uncertainty may be substantial early on, but diminish as data accumulates.
Permanent statistical uncertainty
This arises from incompleteness or inadequacy of data collection that does not diminish with time. In survey research, considerable permanent uncertainty may stem from non-response to the survey or from the possibility that respondents may provide inaccurate data.
Conceptual uncertainty
This arises from incomplete understanding of the information that official statistics provide about well-defined economic concepts or from lack of clarity in the concepts themselves. Therefore, conceptual uncertainty concerns how the statistics are interpreted, rather than their magnitudes.
I wrote a journal paper1 earlier this year where I describe each form of uncertainty at some length and discuss strategies for their measurement and communication. Here is a quick summary of the ideas contained in my paper.
Transitory uncertainty in national income accounts
In the United States, the Bureau of Economic Analysis (BEA) reports multiple vintages of quarterly GDP estimates. An advance estimate combines data available one month after the end of a quarter with trend extrapolations. Second and third estimates are then released after two and three months, when new data become available. A first annual estimate is released in the summer, based on more extensive data collected annually.
The revisions in these estimates are often substantial. For example, in July 2015, the BEA reported an advance estimated annual growth rate of 2.3% in the second quarter of 2015. Then in August, they reported a second estimate of 3.7%, and changes of this magnitude are not atypical.
Measuring transitory uncertainty in GDP estimates is straightforward, if it’s credible to assume that the revision process is stationary in time. Historical data on revisions can then be extrapolated to measure the uncertainty of future revisions. A simple extrapolation would be to suppose that experience in the distribution of revisions in the past will persist in the future.
The Bank of England has shown how this can be done in their regular release of fan charts. The figure below is a fan chart for annual GDP growth in the Bank’s February 2014 inflation report.
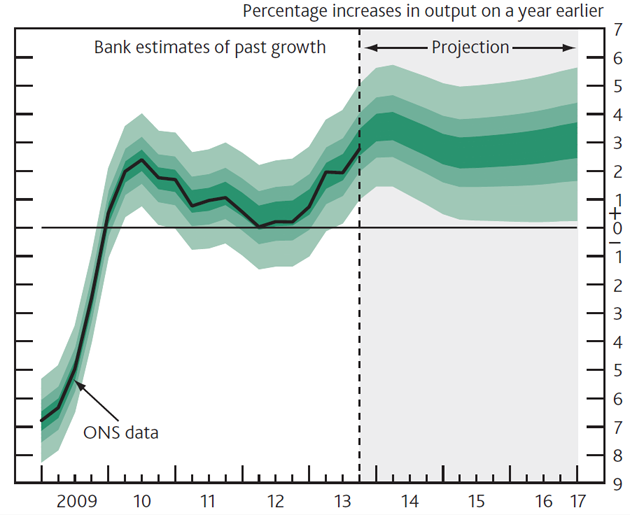
The part of the plot showing growth from late 2013 onwards is a probabilistic forecast that expresses the uncertainty of the Bank’s Monetary Policy Committee regarding future GDP growth. The part showing growth from 2009 through mid-2013 is a probabilistic forecast that expresses uncertainty regarding the revisions that the UK’s Office of National Statistics will henceforth make to its estimates of past GDP. The Bank explains it as follows:
‘In the GDP fan chart, the distribution to the left of the vertical dashed line reflects the likelihood of revisions to the data over the past.’
If you look at the chart from 2010 to 2013, you will notice that it expresses considerable uncertainty about the growth of GDP in this period. So the Bank judges that the future revisions to estimates of past GDP may be large in magnitude.
Permanent uncertainty due to people not responding to surveys
Each year the US Census Bureau reports statistics on the household income distribution, based on income data collected in a supplement to the Current Population Survey (CPS). However, there is a considerable degree of non-response to this survey.
To produce point estimates, the Census Bureau applies hot-deck imputations. But CPS documentation offers no evidence that the hot-deck method yields a distribution for missing data that is close to the actual distribution. A census document describing the American Housing Survey2 is revealing:
'Some people refuse the interview or do not know the answers. When the entire interview is missing, other similar interviews represent the missing ones . . . . For most missing answers, an answer from a similar household is copied. The Census Bureau does not know how close the imputed values are to the actual values.'
Econometric research has shown how to measure uncertainty due to non-response without making assumptions about the nature of the missing data. First, all the values that the missing data can take are contemplated. Then the data yield interval estimates of official statistics. These intervals have been derived for estimates of population means, quantiles and other parameters3. Following on from this, confidence intervals can be produced that jointly measure sampling and non-response error.
Conceptual uncertainty in seasonal adjustment
The US Bureau of Labor Statistics explains seasonal adjustment of employment statistics in this way:
'What is seasonal adjustment? Seasonal adjustment is a statistical technique that attempts to measure and remove the influences of predictable seasonal patterns to reveal how employment and unemployment change from month to month.'
Viewed from a sufficiently high altitude, the purpose of seasonal adjustment in official statistics appears straightforward. But it’s less clear from ground level how one should actually perform seasonal adjustment. Statistical agencies in the United States use the X-12 method. X-12 could be considered a sophisticated and successful algorithm, or it could be an unfathomable black box containing a complex set of statistical operations that lack economic foundation.
There now exists no clearly appropriate way to measure the uncertainty associated with seasonal adjustment. X-12 is a standalone algorithm, not a method based on a well-specified theory of the economy. It’s not obvious how to evaluate the extent to which it accomplishes the objective of removing the influences of predictable seasonal patterns.
To offer a broader picture of analysis, one solution could be to juxtapose X-12 with other proposed algorithms, perform seasonal adjustments with each one, and view the range of resulting estimates as a measure of conceptual uncertainty. A more radical departure from current practice would be to abandon seasonal adjustment and leave it to the users of official statistics to interpret unadjusted statistics as they choose.
Better communication and then understanding its effects
Statistical agencies would better inform policymakers and the public if they were to measure and communicate uncertainties in official statistics, and I urge them to do so.
An open question remains in how the communication of uncertainty would affect policymaking and private decision making. We have little understanding of the ways users of official statistics interpret them. Nor do we know how decision-making would change if statistical agencies were to communicate uncertainty regularly and transparently. This conundrum requires further research to try and gauge how knowledge of the uncertainty would affect the behavior of those involved.
Footnotes
1. Manski, C. (2015), Communicating Uncertainty in Official Economic Statistics: An Appraisal Fifty Years After Morgenstern, Journal of Economic Literature, 53.
2. U.S. Census Bureau (2011), Current Housing Reports, Series H150/09, American Housing Survey for the United States: 2009, Washington, DC: U.S. Government Printing Office.
3. Manski, C. (2007), Identification for Prediction and Decision, Cambridge: Harvard University Press.


