
How many points does a team need to survive in English top-flight football? The rule of thumb is that 40 points guarantees safety – but as several Premier League teams fought relegation at the end of the 2025-26, this belief was tested. So, what should they be striving for this season? Enter the statisticians…
Football folklore
The final week of the 2025-2026 English Premier League (EPL) season was dramatic, culminating in a nail-biting ‘Survival Sunday’. Tottenham was just about to avoid relegation and survive in the EPL with 41 points in a nervous 1-0 victory against Everton. Simultaneously, West Ham’s big win over Leeds on the final day, reaching 39 points, wasn’t enough to get them to safety. While this number would have granted survival in 58% (18 of 31) of previous seasons, West Ham will count themselves, once again, very unlucky – they were relegated. West Ham also holds the unfortunate notoriety of being the relegated team with the highest number of points earned in an EPL season – they were relegated in 2002/03 with 42 points. Bolton (1997/98) and Sunderland (1996/97) were the other two unlucky clubs to go down with 40 points.
After 38 games, where teams earn 3 points for a win and 1 point for a draw, it is taken as common wisdom that accumulating 40 points over a 38-game season will save a team from relegation. Every club looking to survive an English Premier League season always sets its sights on that magic number of 40 points at the beginning of August. A target so well-known that it’s worth investigating. First, is it true? Second, has this target changed over time?
_________________________________________________________________________________________
English Premier League – points and relegation
The English Premier League is comprised of 20 football teams who play each other twice – once at home and once away during the season. Teams that finish at the top of the table earn the right to compete in the Champions League in Europe. The three teams with the lowest point total are relegated to a lower division, which means heartbreak for fans and financial consequences for owners. If two teams finish the season with the same points total, then various tie-breakers are used, including goal difference where the team with the biggest difference between goals scored and goals conceded is ranked higher between two teams with the same point total.
_________________________________________________________________________________________________
Now, before we get into the data, it’s important to understand one thing about this 40-point rule – it’s more of a psychological target than a statistical reality. You are not guaranteed to avoid relegation with 40 points, rather it is a dynamic goal relative to those above you when you are sitting in 18th place. The origins of the 40-point rule are unclear, but it seems to us that it came about in the early years of the EPL based on point totals for different finishing places. A 2018 EPL site reported that “For years, 40 points has been widely touted as the total needed to avoid relegation. However, it has frequently been lower than that.”
As of May 2026, there are a couple of articles about this myth. Firstly, The Athletic looked at the 40-point mark becoming important with four games to go and found that only four teams between the 2001-02 seasons and 2024-25 seasons have had 34 points or higher going into the last four games. Complementary to that analysis, Opta Analyst had projected probability of Tottenham going down (aka being relegated) at 59% with 4 games to be played in the season versus West Ham at 38%. Tottenham taking 7 points from their last four games and impressively beating Villa away really was the difference as West Ham only took 3 points on the last day.
Since the Premier League transitioned to a 20-team format in 1995–96, the average number of points required to finish 17th – a position above relegation – is actually closer to 38 points (Figure 1). Here we see the trends in points accumulated by teams at each finish location in each of three-year intervals: 1996-2005, 2006-2015 and 2016-2026. Teams finishing in positions 18, 19 and 20 are relegated. Thus, the points earned by the position 17 finisher should provide insight into the minimum that is needed to avoid relegation.
| DECADE | ||||
| Finishing Position | 1996-2005 | 2006-2015 | 2016-2026 | Annual Change – Slope Estimate (95% CI) |
| 1 | 84.00 | 87.40 | 90.82 | 0.31 (0.08, 0.54) |
| 2 | 76.40 | 82.30 | 82.45 | 0.27 (0.01, 0.53) |
| 3 | 71.50 | 76.40 | 73.18 | 0.08 (-0.13, 0.30) |
| 4 | 65.50 | 71.20 | 69.55 | 0.16 (-0.01, 0.32) |
| 5 | 61.50 | 65.50 | 67.00 | 0.22 (0.06, 0.39) |
| 6 | 59.00 | 62.30 | 62.82 | 0.16 (0.02, 0.29) |
| 7 | 56.40 | 58.30 | 59.18 | 0.12 (-0.01, 0.26) |
| 8 | 54.10 | 54.20 | 55.64 | 0.06 (-0.11, 0.23) |
| 9 | 52.30 | 51.50 | 52.73 | 0.03 (-0.12, 0.17) |
| 10 | 49.70 | 48.90 | 51.27 | 0.08 (-0.06, 0.21) |
| 11 | 48.60 | 46.80 | 49.18 | 0.03 (-0.09, 0.16) |
| 12 | 47.00 | 45.30 | 47.27 | 0.03 (-0.07, 0.14) |
| 13 | 45.40 | 43.40 | 45.09 | 0.01 (-0.09, 0.11) |
| 14 | 43.70 | 41.80 | 43.45 | 0.01 (-0.09, 0.11) |
| 15 | 43.00 | 40.60 | 41.18 | -0.07 (-0.15, 0.02) |
| 16 | 41.00 | 38.60 | 40.00 | -0.03 (-0.13, 0.07) |
| 17 | 39.50 | 37.20 | 37.27 | -0.10 (-0.20, 0.00) |
| 18 | 36.50 | 35.10 | 32.64 | -0.21 (-0.34, -0.07) |
| 19 | 32.90 | 32.40 | 27.55 | -0.30 (-0.45, -0.16) |
| 20 | 28.80 | 24.80 | 20.64 | -0.35 (-0.59, -0.10) |
Figure 1: Average points by finishing position by decade. The estimated slope (CI) associated with a linear regression to predict points from season number for each finishing position is also included.
We can see from this table that, actually, the average number of points has declined in the last two decades for 17th place, but also for 18th, 19th and 20th place. This suggests, perhaps, that the gap between the top EPL teams and the bottom teams is increasing, a theory supported by the average points of the 1st place team increasing decade to decade. For example, we see that the teams finishing in the 20th position are earning about 0.35 (0.59 to 0.10) fewer points on average each year or 3.5 (5.9 to 1) fewer points every decade, while teams finishing in the 1st position are earning about 0.31 (0.08 to 0.54) more points each year or 3.1 (0.8 to 5.4) more points each decade.
Does this upward change really allow us to infer that the gap is also getting larger? Or were we just lucky to witness a Manchester United, under manager Alex Ferguson, that featured Cristiano Ronaldo, Wayne Rooney and other world-class players enjoy a 3-year period of domination and average 83 points during the 2000s? Similarly, in this last decade we’ve witnessed Pep Guardiola’s Manchester City as the dominant force, averaging 85 points per season. As two United fans, we must admit we’ll be glad to see the back of him, though it’s been remarkable to see how he has truly transformed not just football in England, but ideologies and philosophies around the world.
Anyway, back to the relegation myth and defining survival…
Defining survival
We could focus on the point totals for teams who finished in 17th place, although it may better to consider the points needed to finish a little bit higher than 18th place – for example, 18th place points plus 1 point (or better goal difference if equal points) – as that is the true benchmark for Premier League survival. So, let’s look at that:
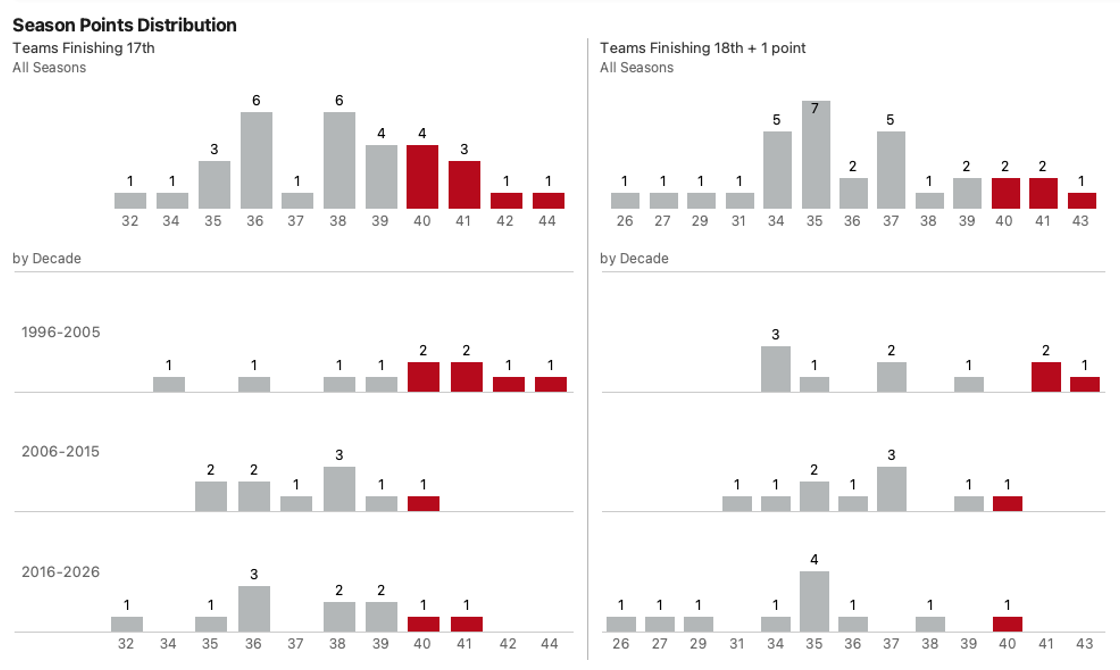
Figure 2: Teams finishing 17th and teams finishing 18th + 1 point in all seasons and by decade.
As you can see from 31 seasons, there have only been 5 other seasons where more than 40 points was required to stay up (only two in the last two decades). Two seasons ago, Tottenham survived with 38 points when Leicester finished in 18th with a historically low 25 points. It’s crazy to think that Tottenham would have been relegated last season with that total, but also only 4 times in the history of the league has 18th place earned less than 34 points. If we return to Figure 1 and consider the 18th plus 1 rule, then the actual points needed to survive season to season looks closer to 36 points, and more recently, in the last decade, only 34 points. This is supported by the histogram showing a target of somewhere between 34 and 37 points, to be more of a reasonable target.
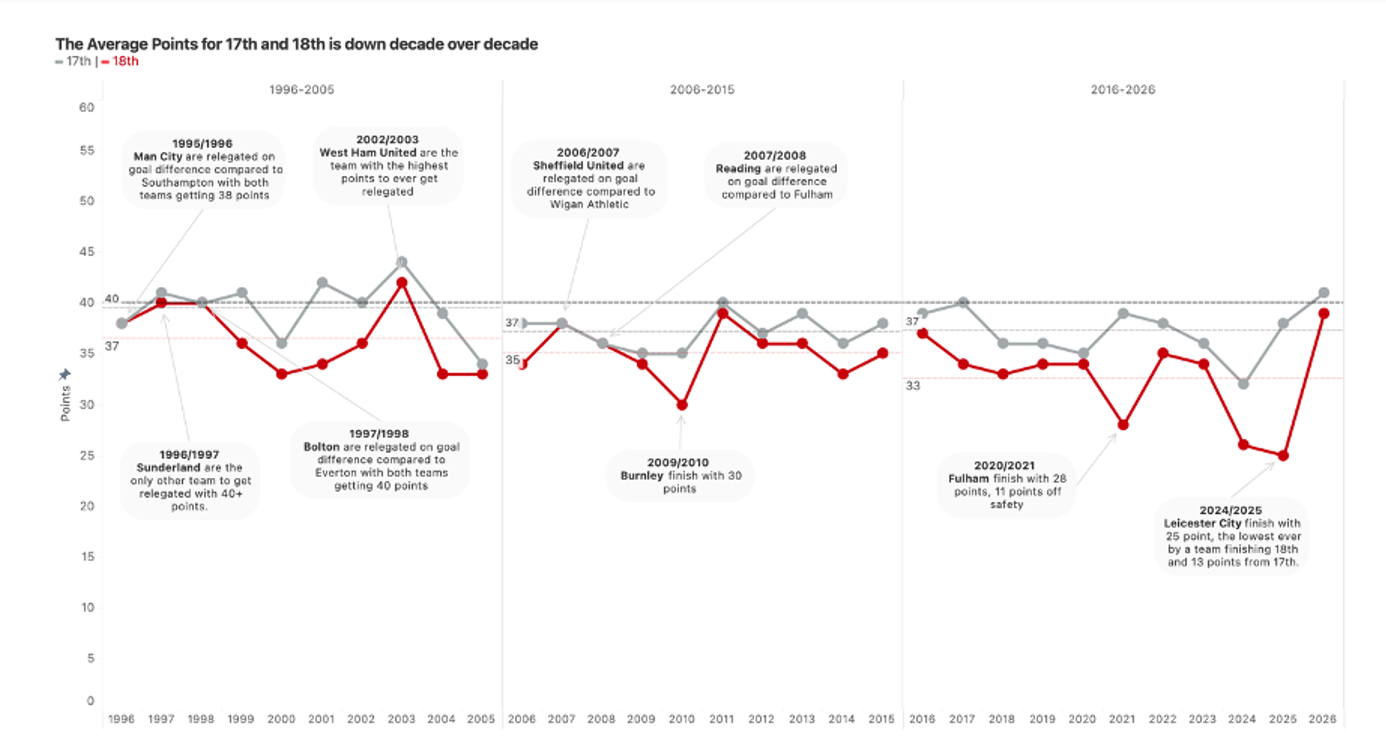 Figure 3: Average points for 17th and 18th placed teams from 1996-2026
If we follow all the seasons more closely, we can see that the gap between 17th and 18th was on average only 3 points (1 win or 3 ties) between 1996- 2006 and around 2 points between 2006 – 2016. Both these decades included two seasons where a team was relegated on goal difference. This last decade, we’ve seen the gap between 17th and 18th increase to closer to 5 points, with two seasons having a gap greater than 10 points.
The outliers
High points relegations
West Ham was once again relegated with an unluckily high points total that would have survived many previous seasons. Fans must have been suffering flashbacks to 2003 when they were relegated with 42 points (the most by any team in Premier League history), despite manager Glenn Roeder’s squad including legends of the game in Paolo di Canio, Ian Pearce and Les Ferdinand, and amazing young talent in Michael Carrick, Jermain Defoe and Joe Cole. His team was considered arguably the best to ever get relegated and were pipped to survival by Bolton Wanderers, Sam Allarydyce’s team assembled of football icons like Jay-Jay Okocha, Youri Djorkaeff and Ivan Campo. West Ham have been relegated three times, with an average of 38 points. Consider them the unluckiest team in Premier League relegations history.
The other year West Ham got relegated was 2010-11 when they finished in 20th with 33 points – but the surprise that season was 18th and 19th places, Birmingham and Blackpool, both going down with 39 points, and Wolverhampton Wanderers finishing at that magic number of 40 points.
Sunderland (1996/97) and Bolton (1997/98) were the two other unlucky teams to get relegated with 40 points or more, with Bolton being joint on points and Everton staying up on goal difference. That leads us into the other teams relegated on goal difference.
Goal difference relegations
Getting relegated on goal difference has to be one of the most heartbreaking experiences a player, team or fan can endure. Almost, but not quite good enough. Just four teams have experienced it in the 30 years of the 20-team-format Premier League. The first was Manchester City, relegated with 37 points in 1996; two years later, Bolton were relegated with 40 points. It wasn’t until 9 years later that we saw back-to-back occurrences of this with Sheffield United losing out to Wigan on 38 points in 2007, and Reading losing out to Fulham on 36 points a year later.
We haven’t seen this rare occurrence in the last decade, but last season was the closest it’s been in a long time. At the other end of the table, goal difference separated the top teams only once. In 31 seasons there have been 5 instances where the league was decided by only one point.
The lucky ones
During the 2023/24 season, Everton and Nottingham Forest were deducted 8 and 4 points, respectively, for breaching profitability and sustainability rules. Despite these deductions, both teams survived: Forest getting 32 points and finishing in 17th place and Everton getting 40 points and finishing in 15th. To put that in perspective, Forest would have been relegated in 27 of the 31 other Premier League seasons and were incredibly lucky that the three promoted sides really struggled (18th place Luton managed a measly 26 points). The following season, we see a similar pattern with the three promoted teams doing poorly and Leicester City getting 25 points in 18th. These two seasons, along with the 2021/22 season that saw Fulham in 18th amass just 28 points, are the only seasons in history where 18th hadn’t scored more than 30 points.
This leans into an interesting question. We know promoted teams are always going to be at risk in their first season in the Premier League, but how often have they actually gone down?
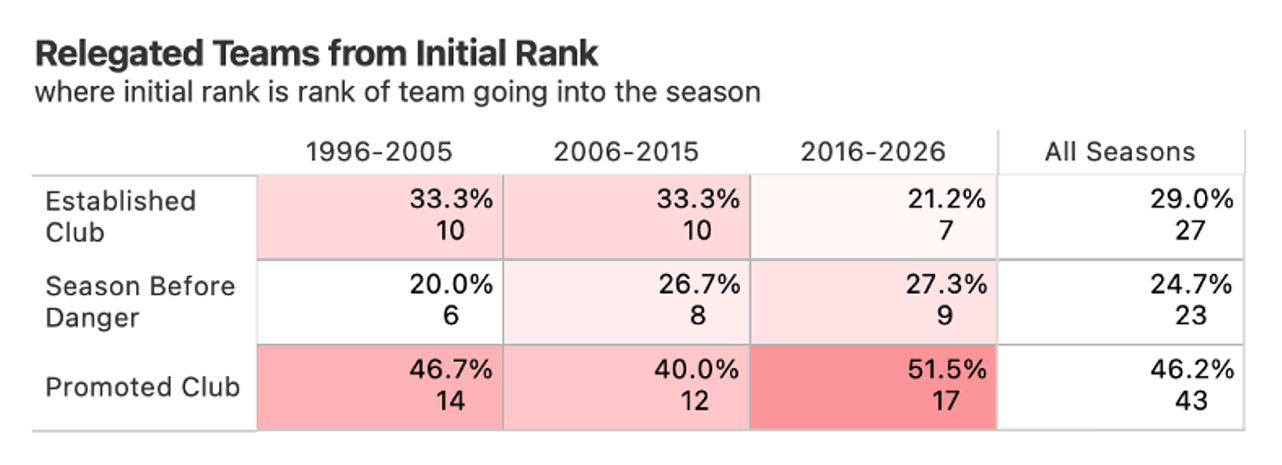 Figure 4: Relegated teams from initial rank – divided into established teams, those that were in danger of relegation the season before, and teams freshly promoted into Premier League.
A decade ago, we explored this intersection of ‘pre-season rankings’ and seasonal simulations in a paper published in CHANCE1, where we evaluated the statistical accuracy of Leicester City’s implied odds of winning the Premier League. In that study, we defined pre-season rankings based on where teams finished the season before, and promoted teams (1st, 2nd and play-off winner from the Championship, the division below the Premier League) being assigned 18th, 19th and 20th. This led us to look in this article at assigning established clubs to pre-season ranks of 1-14; teams who were in danger of relegation the season before as 15-17; and promoted clubs as 18-20. This isn’t perfect, but it does tell us an interesting story. We can see from decade to decade that the promoted teams are at risk, with 46% of them getting relegated in their first season. This percentage has been particularly high in the last decade – 51.5%. We’ve also seen an increase in “in danger the season before” teams getting relegated, and more established clubs less likely to get relegated. If we further revise where clubs finished the season before into the groups “Europe” (i.e. successful enough to play in the Champions League), “top half” (of Premier League), “bottom half” (ditto) and “promoted clubs”, then we can see that, during 1996-2005, two clubs were relegated that had finished in Europe the season before. Blackburn Rovers were relegated in 1998/99 after finishing 6th the season before, and Ipswich Town got relegated after finishing 5th the season before in 2001/02. The probability of relegation for a team that finished in the top half over the last 30 years is less than 10% and in the last two decades is closer to 6%:
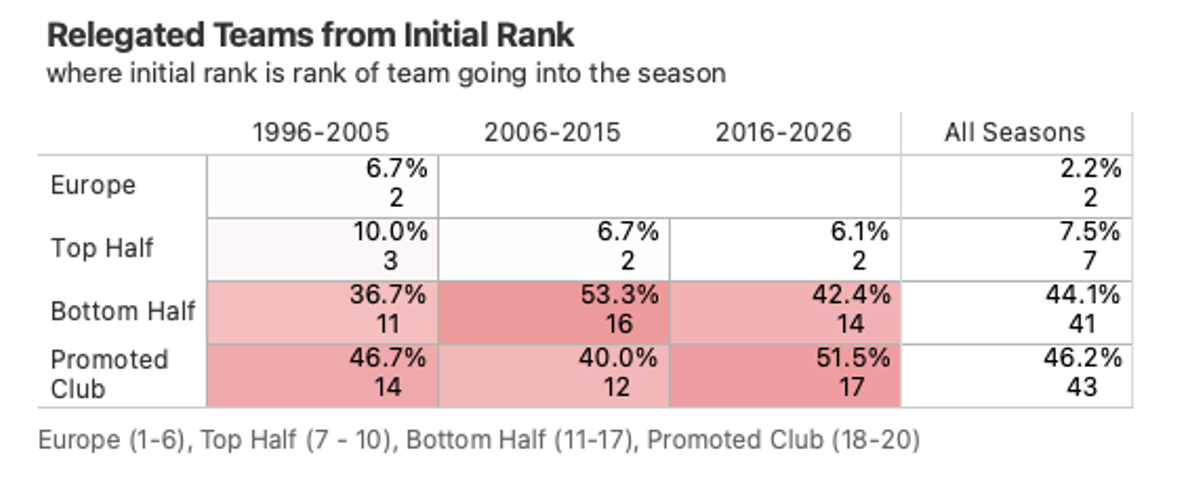 Figure 5: Relegated teams from initial rank – divided into the groups “Europe”, “top half”, “bottom half” and “promoted”.
What are clubs’ histories with points and relegation?
The history of 24 different club finishes is captured by the beeswarm plot below. This plot doesn’t include teams that have never finished in or near the relegation zone (e.g. Liverpool, Chelsea, Manchester United).
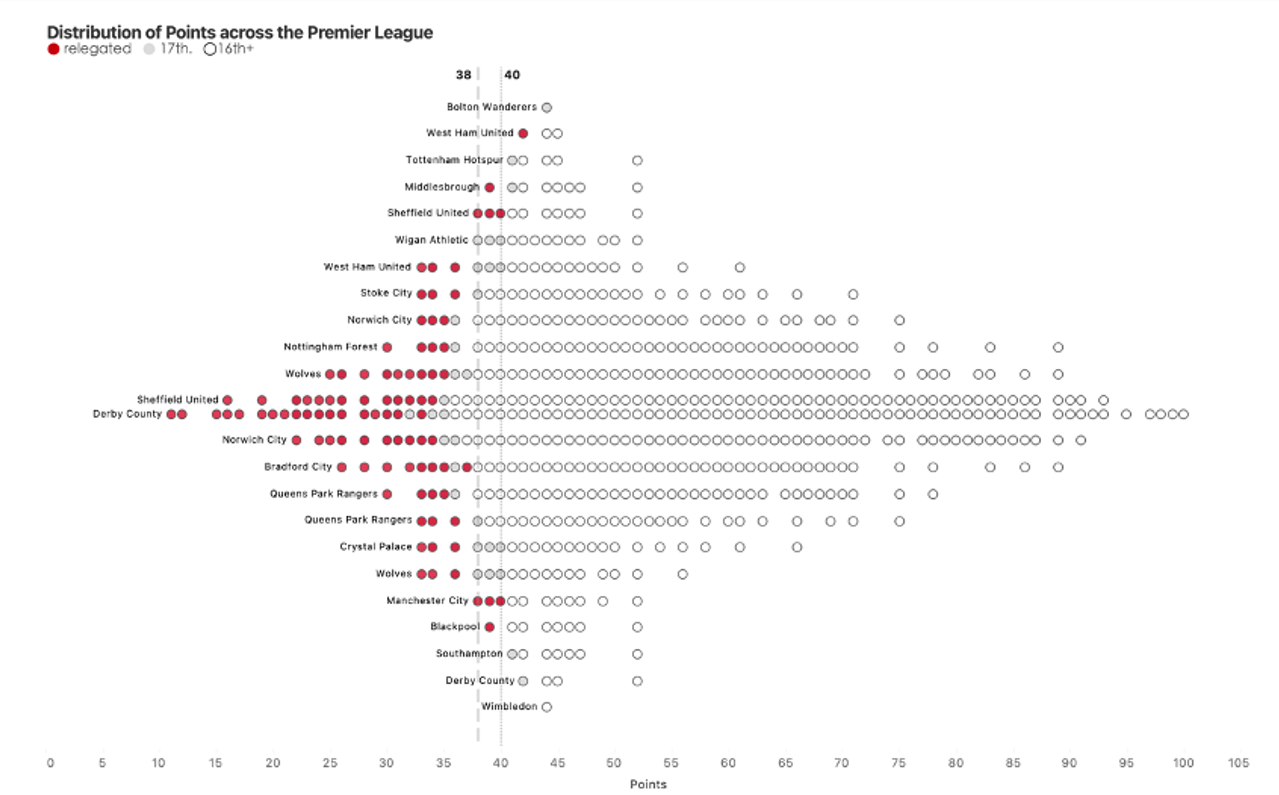
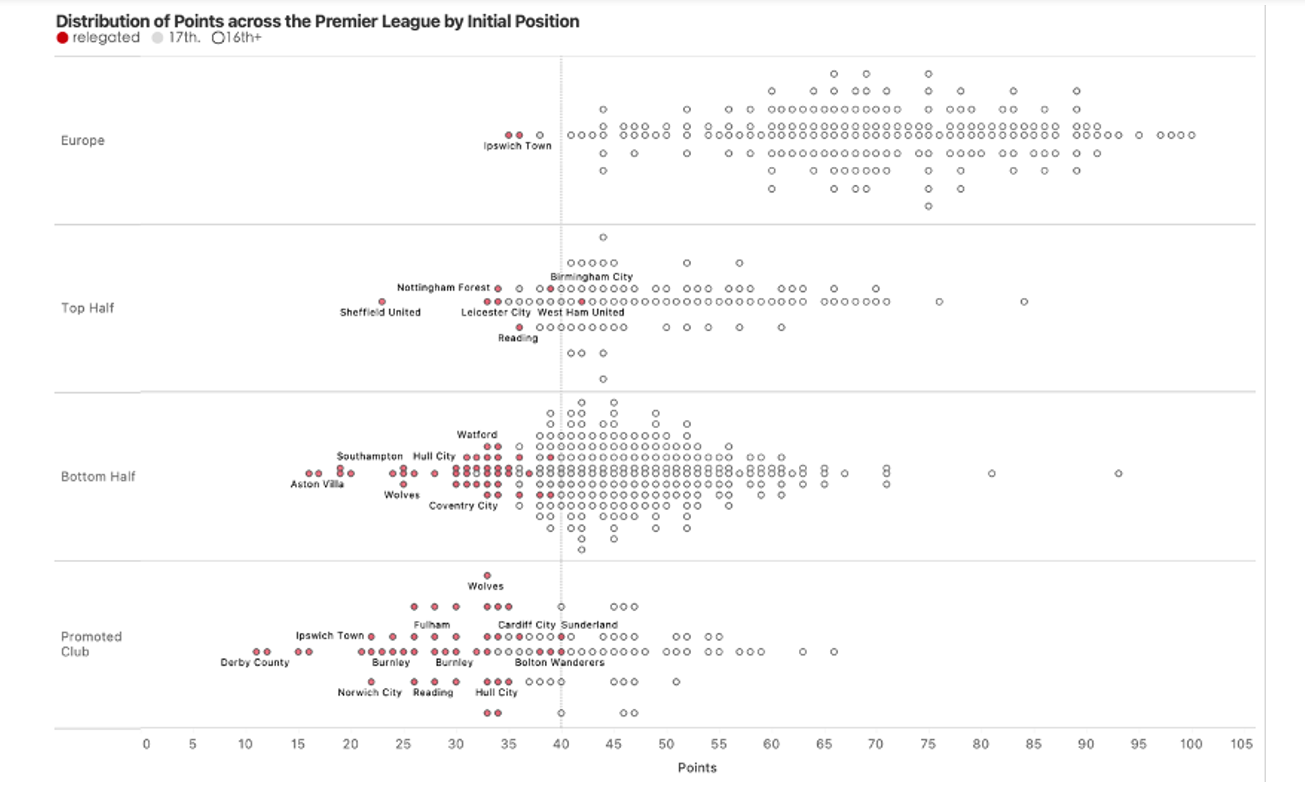
Figure 6: Distribution of points across the Premier League by initial position.
These charts highlight how rare it is for clubs with 40 points to get relegated and support the evidence that the true line to meet survival is closer to 38 points (further reading can be found here and here). The faceted chart shows how vulnerable promoted clubs are when they reach the Premier League, but also how finishing in the bottom half the season before can be a good indicator of a team going down the following season.
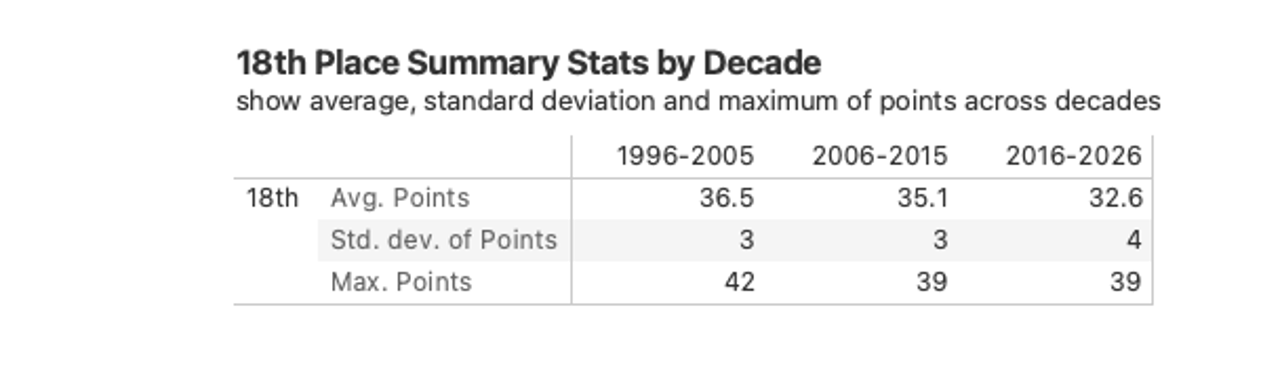 Figure 7: 18th place summary stats by decade.
By giving this 40-point marker, we are also giving a value just inside 2 standard deviations away from the average points of 18th place.
Should the 40-point myth persist?
This myth persists because 40 points is a very good target for clubs to have and, let’s be honest, a nice round number just sounds better. Studies have shown that people have faster comprehension when it comes to round numbers and that there is a wider perception of trust2. If pundits and journalists start talking about 38 points, rather than 40, it will certainly stir up those fans who believe football’s gone soft (or that, in the slang of the day, the “game’s gone”) …
The target of 40 points appears to function as a reasonable rule of thumb, particularly in the last 10 years of EPL play. It will be interesting to see how this next decade goes. Will we see more of the same when it comes to the distribution of points for teams getting relegated? Or will the increasing financial gulf between the top Premier League teams and everyone else cause a yo-yo of clubs moving up and down from the Championship? This past season was a breath of fresh air, with two promoted clubs staying up – can they survive the second season syndrome and sustain their Premier League status? Only time will tell. One thing is beyond question: we’re excited for the new season to get underway so we can find out.
References
- Heard, C. A., & Bailer, A. J. (2018). Defying the Odds: How Likely Are We to See Another Team Pull a ‘Leicester’ and Win the EPL? CHANCE, 31(3), 59–66. https://doi.org/10.1080/09332480.2018.1522215
- Nguyen, H.A., Hofman, J.M. and Goldstein, D.G. (2022). Round Numbers Can Sharpen Cognition. Proceedings of the 2022 CHI Conference on Human Factors in Computing Systems. https://doi.org/10.1145/3491102.3501852
Data sourced from Wikipedia.
Craig Heard is quant analytics manager at JPMC and has a Masters in statistics from Miami University, Ohio, USA.
John Bailer is Professor Emeritus of Statistics at Miami University in Ohio, USA, creator of the Stats + Stories podcast, and a member of the Significance editorial board.
You might also like: Bend it like Beckham: the statistics of women’s football
Home advantage: What’s changed since Covid?