
Much has been said about the demographic trends of Covid-19. It has been widely reported that deaths are more common in males; more common in the elderly; and more common amongst those with an “underlying health condition”. But to what extent is this the case? And how are these variables associated with each other?
The data
Data released by the Office for National Statistics (ONS) reports the number of Covid-19 deaths occurring in March, April and May, in England and Wales, by gender, age and the main underlying health condition (UHC).
The five most prevalent UHCs were (by ICD-10 code): “Chronic lower respiratory diseases’’, “Dementia and Alzheimer’s disease’’, “Influenza and pneumonia’’, “Ischaemic heart diseases’’ and “No pre-existing conditions’’. By including an additional category, “Other’’, to encompass those individuals with a rarer UHC, the data can be expressed in a three-way contingency table of gender, age (in three categories) and UHC. The table is shown below, along with an alluvial plot.1
Table 1: Data showing the number of deaths from Covid-19 in March, April and May in England and Wales. Source: ONS.
| Gender | Age | Underlying health condition | Total | |||||
| Ischaemic heart disease | Dementia and Alzheimer’s disease | Influenza and pneumonia | No pre-existing condition | Chronic lower respiratory diseases | Other | |||
| Male | ≤59 | 128 | 7 | 304 | 377 | 114 | 1066 | 1996 |
| 60–79 | 1546 | 972 | 954 | 894 | 1088 | 4220 | 9674 | |
| 80+ | 1938 | 4449 | 1341 | 1094 | 845 | 4500 | 14167 | |
| Female | ≤59 | 30 | 5 | 120 | 137 | 95 | 714 | 1101 |
| 60–79 | 241 | 886 | 488 | 493 | 929 | 2399 | 5436 | |
| 80+ | 730 | 5630 | 1032 | 1248 | 739 | 4934 | 14313 | |
| Total | 4613 | 11949 | 4239 | 4243 | 3810 | 17833 | 46687 | |
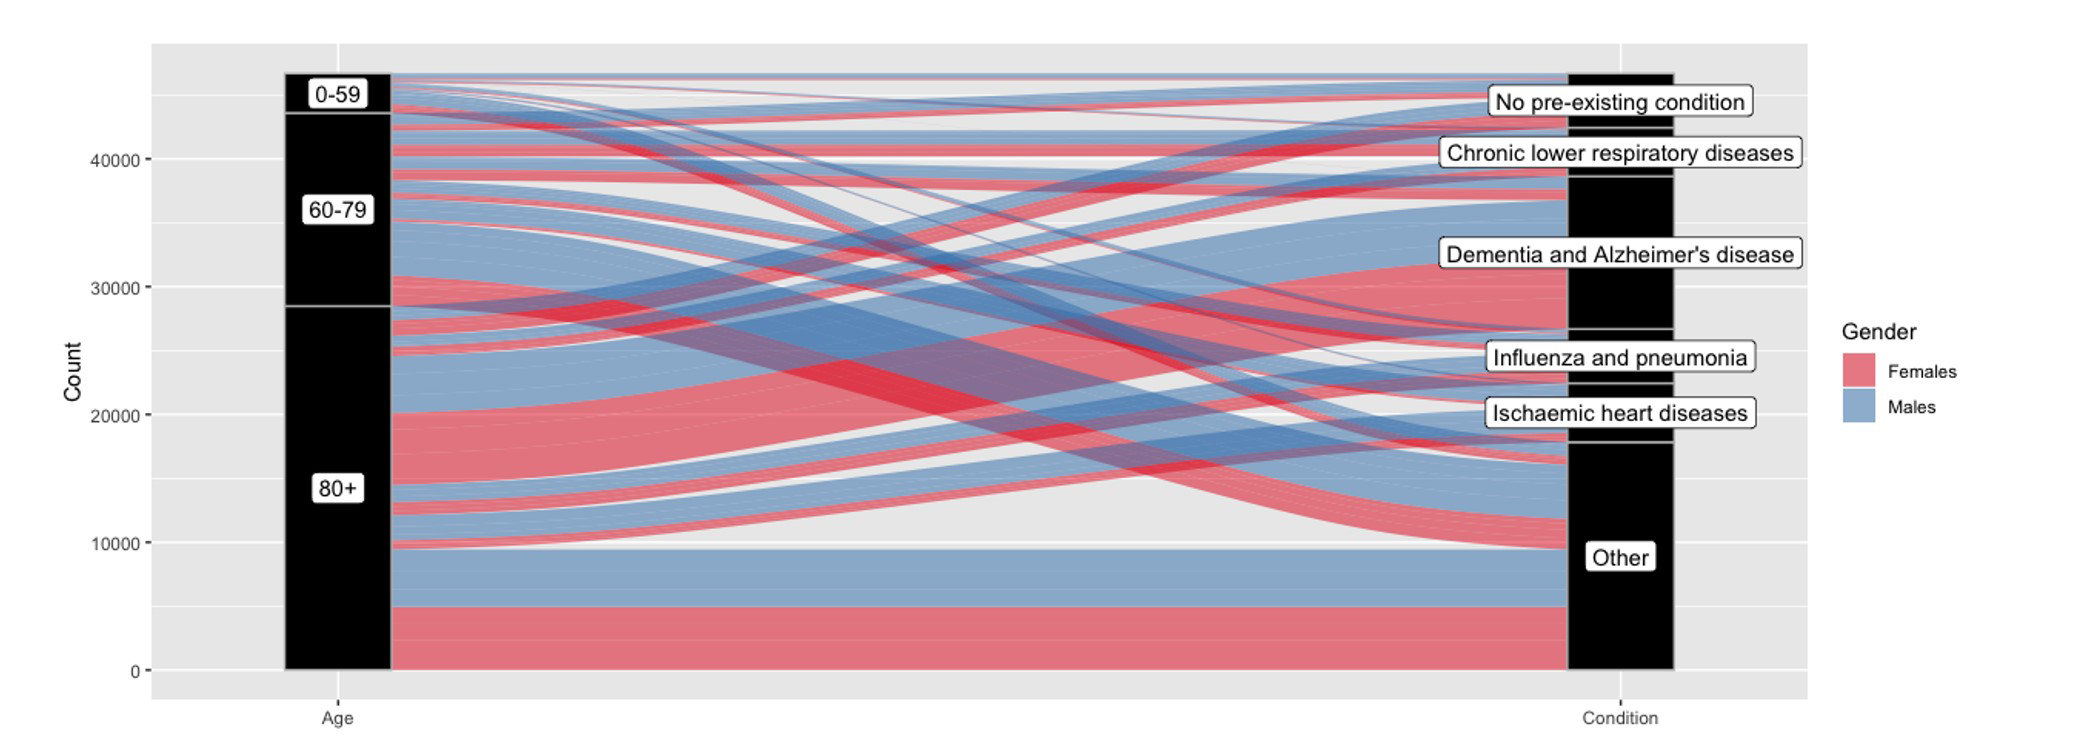
Figure 1: An alluvial plot showing the number of Covid-19 deaths in March, April and May by gender, age and main underlying health condition. The left vertical axis represents age and is made up of three vertical blocks. The height of each block is proportional to the number of deaths in each age category. Similarly, the right vertical axis represents UHC. The alluvia are the wavy lines that map the two axes. The thickness of the alluvia are also proportional to the number of deaths. Gender is represented by the colour of the alluvia: females, red; males, blue. For example, the bottom two alluvia show that there were roughly equal numbers of male and female deaths in those aged 80 or above with an “other” UHC. Source: ONS.
Log-linear model
The counts in Table 1 can be modelled by a Poisson log-linear model, which assumes that the counts are independent and Poisson distributed. For UHC and age, which are both categorical variables, “No pre-existing conditions” and “<60” were chosen as the reference categories, respectively.
Independence model
First, the independence model was fitted to the data (in R using the glm function). When exponentiated, the parameters from this model estimate the odds of a Covid-19 death in a given category – that is, the probability of a Covid-19 death in a given category relative to the probability of a Covid-19 death in the reference category.
Although unreported, for UHC the odds for dementia and Alzheimer’s disease and ischaemic heart disease are greater than 1, which tells us that Covid-19 deaths with either of these are more likely than Covid-19 deaths with no pre-existing condition. The odds for chronic lower respiratory diseases and influenza and pneumonia are less than 1, so deaths with these UHCs are less likely than deaths with no pre-existing condition.
Also, deaths are more likely to occur in the age categories “60-79” and “80+” than in the category “≤59”; and male deaths are more likely than female deaths.
But these trends have been well-documented; less well-documented are the associations which exist between these three variables.
All two-way interaction model
Second, the all two-way interaction model was fitted to the data. This model assumes the existence of pairwise dependencies between the three variables. For example, for UHC and gender it means that the odds of a Covid-19 death with a given UHC varies in males and females.
There are five distinct associations between UHC and gender. Each association is represented as a conditional odds ratio (OR). This is the ratio between the odds of a Covid-19 death for a given UHC (no pre-existing condition as the reference) in males and the odds for the same UHC in females, given that age remains fixed. Odds ratios of 1 for this interaction would imply that the odds for the various UHCs are unaffected by gender (and vice versa) – that is, it would imply that UHC and gender are independent. These conditional ORs are reported in Table 2.
For illustration, the conditional odds ratio of 2.96 for males with ischaemic heart disease can be interpreted as: for any given age, compared to those with no pre-existing conditions, Covid-19 deaths of males with ischaemic heart disease are 2.96 times as likely than deaths of females with ischaemic heart disease.
Also, the odds of a male death are higher than females for those with influenza and pneumonia than for those with no pre-existing condition (OR of 1.27), whereas the odds of a female death are higher than males for those with chronic lower respiratory diseases, dementia and Alzheimer’s disease and other conditions than for those with no pre-existing condition (ORs of 0.86, 0.77 and 0.95, respectively).
For the UHC and age interaction, the conditional odds ratios are all greater than one which suggests that, for a fixed gender, the odds of a death for individuals with any UHC are greater than for those with no pre-existing conditions for those aged 60 or above compared to those aged 59 or below.
The two odds ratios for dementia and Alzheimer’s disease are huge (recorded on the log scale in Table 2) which shows, unsurprisingly, that such deaths are more common in the elderly. A notable observation is that, for chronic lower respiratory diseases, the odds ratio is lower in the “80+” category than in the 60-79 category (ORs: 3.57 and 1.63).
The age and gender interactions are also informative. For a fixed UHC, the odds of a male death are about 40% lower than females for those aged 80 or above than for those aged 59 or below.
Interestingly, the model’s residual deviance is 153.5 on 10 degrees of freedom. This indicates poor goodness-of-fit and suggests that the saturated model may be more suitable. This hints at a three-way association, which is when the size of a two-way association varies with respect to a third variable.
Table 2: The conditional odds ratios from the Poisson log-linear model with all two-way interactions with a Wald confidence interval.
| Interaction | Estimated odds ratio | 95% confidence interval |
| UHC-Gender Interaction | ||
| Ischaemic heart diseases, Male | 2.96 | (2.69, 3.25) |
| Dementia and Alzheimer’s disease, Male | 0.77 | (0.72, 0.83) |
| Influenza and pneumonia, Male | 1.27 | (1.16, 1.39) |
| Chronic lower respiratory diseases, Male | 0.86 | (0.78, 0.94) |
| Other, Male | 0.95 | (0.89, 1.02) |
| UHC-Age Interaction | ||
| Ischaemic heart diseases, 60-79 | 4.22 | (3.48, 5.11) |
| Ischaemic heart diseases, 80+ | 4.21 | (3.49, 5.08) |
| Dementia and Alzheimer’s disease, 60-79 | 4.05* | (3.47, 4.62) |
| Dementia and Alzheimer’s disease, 80+ | 5.18* | (4.61, 5.75) |
| Influenza and pneumonia, 60-79 | 1.26 | (1.09, 1.46) |
| Influenza and pneumonia, 80+ | 1.27 | (1.10, 1.46) |
| Chronic lower respiratory diseases, 60-79 | 3.57 | (3.00, 4.25) |
| Chronic lower respiratory diseases, 80+ | 1.63 | (1.37, 1.94) |
| Other, 60-79 | 1.38 | (1.23, 1.54) |
| Other, 80+ | 1.16 | (1.04, 1.29) |
| Gender-Age Interaction | ||
| Male, 60-79 | 0.97 | (0.89, 1.05) |
| Male, 80+ | 0.57 | (0.52, 0.62) |
*The log odds ratio.
Summary and limitations
Ethnicity would also make for an interesting comparison, given that certain ethnic subgroups seem to have been more affected than others. Unfortunately, the four-way marginal table between age, gender, UHC and ethnicity has not yet been disseminated.
Odds ratios are useful for establishing how the number of Covid-19 deaths vary with respect to these variables. But they do not provide a measure of risk for an individual who observes a particular category pattern. This is because the numbers in the population who belong to each category have not been taken into account. A measure of relative risk would be more informative in this regard.
Moreover, in this investigation the partial associations have been calculated. That is, the pairwise associations have been estimated, conditional on the third variable. An alternative is to estimate the association independently of the third variable – that is, the marginal association.
As a check, the marginal associations have been calculated and were found to be similar to their partial equivalent. For example, if age is not accounted for, the marginal odds ratio for males with ischaemic heart disease is 2.87 (compared to the partial OR of 2.96).
There is the possibility that these associations could change substantially – even change direction – with respect to a fourth variable, such as ethnicity. This would happen if, say, ethnicity is closely correlated to any of the other variables. Such a phenomenon is widely known as Simpson’s paradox, named after the British statistician Edward Simpson, who highlighted the issue.2
Finally, the log-linear model is able to identify associations (correlation), but cannot be used to determine cause-and-effect.
Hopefully this article has provided a clearer insight into the Covid-19 demographic trends. It seems that age, gender and underlying health condition are associated to each other and that the strength of these associations vary significantly.
About the author
James Jackson is a PhD student in the Department of Mathematics and Statistics, Lancaster University.
Acknowledgements
Thank you to Professor Brian Francis and the Significance editors for their help with this article.


