

This article explores what people mean when they talk about testing for Covid-19 and how we should interpret test results. There are two main types of tests: those that detect active infection, and those that test past infection.1
To test for active infection, we can use a polymerase chain reaction (PCR) test. PCR allows scientists to find pieces of DNA within samples. The genome of SARS-CoV-2, the virus that causes Covid-19, is encoded by RNA, a slightly different chemical form from DNA, but the test works in the same way. Scientists already know the genetic sequence they are looking for, so they create a tag which lands on that genetic sequence. PCR then copies that section of genetic material again and again until millions of copies make it easily detectable. In this way, a swab sample from the respiratory tract (nose or throat) can be tested using PCR for presence of the virus. If the virus was not present in the sample, the PCR test would not have made copies and the test would be negative.
Ideally for PCR tests, the nose/throat sample should be taken within 7 days of the onset of symptoms to be effective. Currently available Covid-19 PCR tests take a few hours or even days to get a result.
To test for past infection, we use an antibody test to look for antibodies against the virus in a blood sample. When a person is infected by SARS-CoV-2, their body develops antibodies which attach to the virus to target it for destruction by the immune system. Antibody tests detect the presence of antibodies specific to SARS-CoV-2. With a single-prick blood-test for present antibodies, a home test or point-of-care test can take only 10-15 minutes to administer and obtain a result. Antibody tests provide a measurement of the immune response after someone has had Covid-19, and they are best used about 3-4 weeks after infection onset. It is still debatable whether the presence of antibodies means a person is immune to future infection from SARS-CoV-2. Also, there are multiple versions of antibody tests currently under development, so test performances have not been fully validated (see, for example, FIND SARS-CoV-2 immunoassays evaluation).
Table 1 gives a summary of the two types of test. Generally speaking, PCR tests give more accurate diagnostic results but are slow to deliver a result. Antibody tests are less accurate and take longer to develop, but they are easy to use and quicker to deliver results. The UK government has not yet released any official information about the cost of each type of test.
TABLE 1 Summary of test characteristics.
| PCR | Antibody test | |
| Type | Molecular | Serological, immunoassay |
| Time to result | 2 hours – several days | 10–15 minutes |
| Sample | Throat or nasal swab | Blood |
| Time of test | < 7 days after infection | ~ peak 3–4 weeks after symptom onset |
| Detects | DNA (RNA) | Antibodies |
Imperfect performance
PCR and antibody tests do not always give the correct result for several reasons.
For PCR, the time at which the test is taken matters. This is related to something called viral load, which refers to how much virus is present in an infected person’s body. Usually, the higher the viral load, the more severe the disease. Viral load is also associated with “shedding”, which describes how much virus an infected person is producing and releasing; more shedding means the virus is more likely to be detected.
For the antibody test, an incorrect result may be due to identifying people with an immune response to other human coronaviruses such as the common cold, or it may not detect cases with low immune response to the infection, perhaps due to the test being used too soon since infection.
In statistical terms, a test’s performance can be represented by its sensitivity and specificity. Sensitivity is the probability that a test will give a positive result if you actually have the infection. Conversely, specificity is the probability that a test will give a negative result if you don’t have the infection. A test with less than 100% sensitivity will judge patients to not have the infection when in fact they do, called a false negative (FN), and a test with less than 100% specificity will rule in infection-free people, called a false positive (FP).
There is often a performance trade-off between the number of FPs and FNs, since the more sensitive a test is – i.e. how readily it positively diagnoses someone – the more likely it may be to incorrectly rule people in. As an extreme example, a perfectly sensitive test could simply judge everyone to have the infection, at the expense of all infection-free individuals being false positives.
Obtaining test performance statistics
It is not easy to obtain performance statistics for the Covid-19 tests, because it is a new disease and many of the tests are still in development.
For example, the Foundation for Innovative New Diagnostics (FIND) has hundreds of Covid-19 tests listed with links for further details. Unfortunately, the information provided about the tests is often unclear or missing. Even when there are statistics available, values can vary widely between tests, and individual test statistics themselves have uncertainty.
Therefore, the test numbers we use are for demonstration purposes only and have been selected to be the most representative as of 1 May 2020.
For active infection
The Belgium company CORIS Bioconcept has developed a Covid-19 antigen detection Rapid Diagnostic Test (Covid-19 Ag Respi-Strip). With high viral load, it has test sensitivity of 85%, but for all samples the overall sensitivity is 60%; specificity is 100%.2
Public Health England (PHE) is recommending PCR for screening and testing, and is evaluating 19 tests as of 16 March 2020.3 One of these, called Novacyt Primerdesign, has sensitivity of 88.66% and specificity of 90.63%.
For past infection
The US Food and Drug Administration has approved first the qSARS-CoV-2-IgG/IgM Rapid Test. It has specificity of 95.6% and sensitivity of 93.8%. There is also BioMedomics COVID-19 IgM/IgG Rapid test, which has sensitivity of 88.7% and specificity of 90.6%.4
More recently, Public Health England has approved a test by the Swiss pharmaceutical company Roche, with claimed sensitivity of 100% and specificity of 99.8%.
The sensitivity and specificity of each test is summarised in Table 2.
TABLE 2 Specific test performance summary statistics.
| Test | Sensitivity (%) | Specificity (%) |
| For active infection | ||
| CORIS Bioconcept | 85*/60** | 100 |
| Novacyt Primerdesign | 88.66 | 90.63 |
| For past infection | ||
| qSARS-CoV-2-IgG/IgM | 93.8 | 95.6 |
| Biomedomics Rapid IgM-IgG | 88.7 | 90.6 |
| Roche | 100 | 99.8 |
*with high viral load; **overall
How are the tests being used?
Each day in the UK, the Department for Health and Social Care (DHSC) reports online the number of tests and number of confirmed positive cases. The UK government has five “pillars” forming its testing strategy. Testing data are provided for pillars 1, 2 and 4, and data for pillars 1 and 2 are shown in the top half of Table 3. The government definitions of each pillar are:
- Pillar 1: Swab testing in PHE labs and NHS hospitals for those with a medical need (most seriously ill) and the most critical (frontline) workers and their families.
- Pillar 2: Swab testing for key workers and their households. This includes people whose jobs are vital to public health and safety such as NHS staff, teachers, food chain workers and police.
- Pillar 3: Mass-antibody testing to help determine if people have immunity to coronavirus.
- Pillar 4: A national surveillance programme for population blood testing, using a high accuracy antibody test operated by Public Health England to find out what proportion of the population have had the virus.
- Pillar 5: Spearheading a Diagnostics National Effort to build a mass-testing capacity at a completely new scale.
From 1 May, the UK government changed the test count to include tests that hadn’t yet been taken or analysed.
Also, some people included in the test count have been tested more than once. Repeat testing happens, for example, when a clinician suspects Covid-19 (e.g. flu-like symptoms) and the test returns a negative result. The DHSC site does not provide any extra information with respect to the distribution of the number of times people are tested.
So, it is not possible to make an accurate estimate of positivity from the released statistics. However, we will use an example of daily figures to demonstrate how we can think about testing statistics. We will use figures from 13 April, when a cumulative number of 290,720 people had been tested, and 88,621 tested positive.
Estimating values using test results
Two ways that the test results can be used are: (1) to inform on the status of an individual for diagnosis, patient management and contact tracing, or (2) for population prevalence estimates and wider public health decisions. Because of FP and FN errors in test results, the latter may be the most useful application.
We can calculate a population prevalence estimate with the following equation:5
True prevalence estimate = (Prob(positive test result) + specificity – 1)/(sensitivity + specificity – 1)
Let us assume that all of the tests reported on the DHSC website use either the CORIS or Novacyt tests, with sensitivity and specificity values given in Table 2. Using the above equation, we can estimate the true Covid-19 prevalence on that date for pillars 1 and 2. Table 3 and Figure 1 show the observed test positivity and an estimated true prevalence for the CORIS and Novacyt tests.
TABLE 3 Daily Covid-19 counts from gov.uk website on 13th April 2020, with estimates of true prevalence based on CORIS and Novacyt test sensitivity and specificity values.
| Pillar 1 | Pillar 2 | |
| Tests | 12,081 | 2,486 |
| Positive | 4,468 | 784 |
| True prevalence estimates | ||
| CORIS Bioconcept (high viral load) | 5,256 | 922 |
| CORIS Bioconcept (overall) | 7,447 | 1,307 |
| Novacyt Primerdesign | 4,207 | 695 |
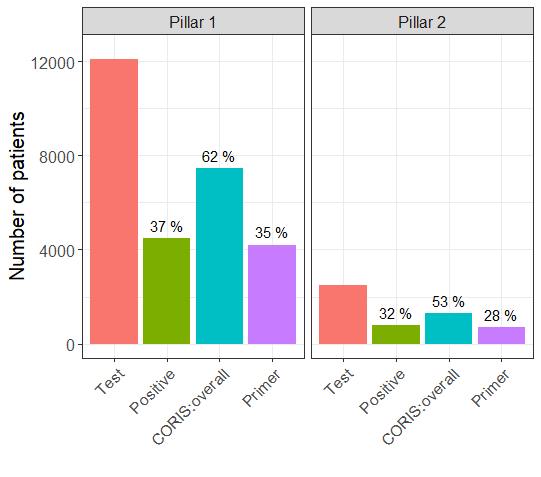
FIGURE 1 Bar plots for test results, and true prevalance estimates based on CORIS and Novacyt (“Primer”) test sensitivity and specificity values, by UK government testing strategy pillars. The numbers above the bars are the percentage of positive results out of the number of tests performed.
For pillar 1, using CORIS Bioconcept, we estimate more true positives than the observed number of positives. Using Novacyt Primerdesign, we estimate slightly fewer true positives than the observed number of positives.
If we do not have test results, like for the antibody tests which are still in development, we can still calculate the FP and FN for a “high” and “low” prevalence of prior Covid-19 infection using the following:
FP = (1 – prevalence) × (1 – specificity)
FN = prevalence × (1 – sensitivity)
Table 4 gives test statistics estimates for the three antibody tests in Table 2. For the first two tests, when prevalence is low, the number of false positives is relatively high, and so if someone tests positive with a BioMedomics test, there is only a 33% (= 4,435/13,365) chance of having the disease. If prevalence is high then there is a 70% (= 17,740/25,260) chance of having the disease. For the Roche test, however, a negative result is guaranteed to be correct, and a positive test result has a 4% (= 190/5,190) and 1% (= 160/20,160) chance of being wrong for 5% and 20% prevalence, respectively.
TABLE 4 Antibody test statistics estimates (e.g. Pillar 4). Test counts and prevalence are for demonstration purposes.
| Prevalence | Tests | Positive | False positives (FP) | True positives (TP) | False negatives (FN) | True negatives (TN) | |
| BioMedomics | 5% | 100,000 | 13,365 | 8,930 | 4,435 | 565 | 86,070 |
| 20% | 25,260 | 7,520 | 17,740 | 2,260 | 72,480 | ||
| qSARS-CoV-2-IgG/IgM | 5% | 8,870 | 4,180 | 4,690 | 310 | 90,820 | |
| 20% | 22,280 | 3,520 | 18,760 | 1,240 | 76,480 | ||
| Roche | 5% | 5,190 | 190 | 5,000 | 0 | 94,810 | |
| 20% | 20,160 | 160 | 20,000 | 0 | 79,840 |
Figure 2 shows estimated test statistics for the BioMedomics antibody test with prevalence of 5%.
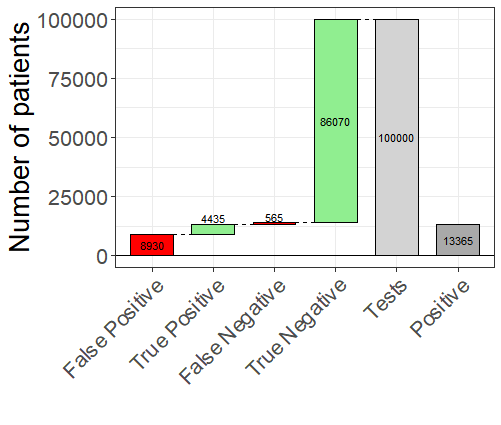
FIGURE 2 Waterfall plot of results for BioMedomics antibody test assuming 5% prevalence. Green bars indicate agreement between observed and true test results and red indicate disagreement.
Conclusions
Testing for active or past Covid-19 infection is not perfect. For population-level estimates of prevalence, we can still make good use of this data. But for individual diagnostics, test results should be used with caution.
Incorrectly ruling someone as having Covid-19 would incur a financial cost (e.g. time off work) as well as some psychological cost. Incorrectly ruling someone as not having the infection could mean future health risk for the individual and uncontrolled spread of Covid-19 amongst the community.
About the author
Nathan Green is a statistician and mathematical modeller research fellow in the Department of Infectious Disease Epidemiology at Imperial College London.
References
- Patel, R., Babady, E., Theel, E. S., Storch, G. A., Pinsky, B. A., St George, K., Smith, T.C. and Bertuzzi, S. (2020) Report from the American Society for Microbiology COVID-19 International Summit, 23 March: Value of Diagnostic Testing for SARS-CoV-2/COVID-19. mBio. 2020 Mar 26;11(2). pii: e00722-20. doi: 10.1128/mBio.00722-20. ^
- Mertens, P., De Vos, N., Martiny, D., Jassoy, C., Mirazimi, A., Cuypers, L., Van den Wijngaert, S., Monteil, V., Melin, P., Stoffels, K., Yin, N., Mileto, D., Delaunoy, S., Magein, H., Lagrou, K., Bouzet, J., Serrano, G., Wautier, M., Leclipteux, T., Van Ranst, M., Vandenberg, O. and LHUB-ULB, SARS-CoV-2 working diagnostic group (2020) Development and Potential Usefulness of the COVID-19 Ag Respi-Strip Diagnostic Assay in a Pandemic Context. Front. Med. 7:225. doi: 10.3389/fmed.2020.00225 ^
- Publications approval reference: 001559, Guidance and standard operating procedure COVID-19 virus testing in NHS laboratories. ^
- Fast, portable tests come online to curb coronavirus pandemic, 23 March 2020. ^
- Estimating Prevalence Using an Imperfect Test, Peter J. Diggle, Hindawi Publishing Corporation Epidemiology Research International, Volume 2011, Article ID 608719. ^


