
Data
We used data from the sources listed below:
1. Ballotpedia.
- Endorsements by Donald Trump. https://ballotpedia.org/ Endorsements_by_Donald_Trump [accessed 26 March 2021].
- U.S. Senate battlegrounds, 2018. https://ballotpedia.org/U.S._Senate_battlegrounds,_2018 [accessed 31 May 2021].
- U.S. Senate battlegrounds, 2020. https://ballotpedia.org/U.S._Senate_battlegrounds,_2020 [accessed 31 May 2021].
2. Polling Report. Pollingreport.us – public opinion online. http://www.pollingreport.us [accessed 23 May 2020].
Deviation of polls from the election outcome over time
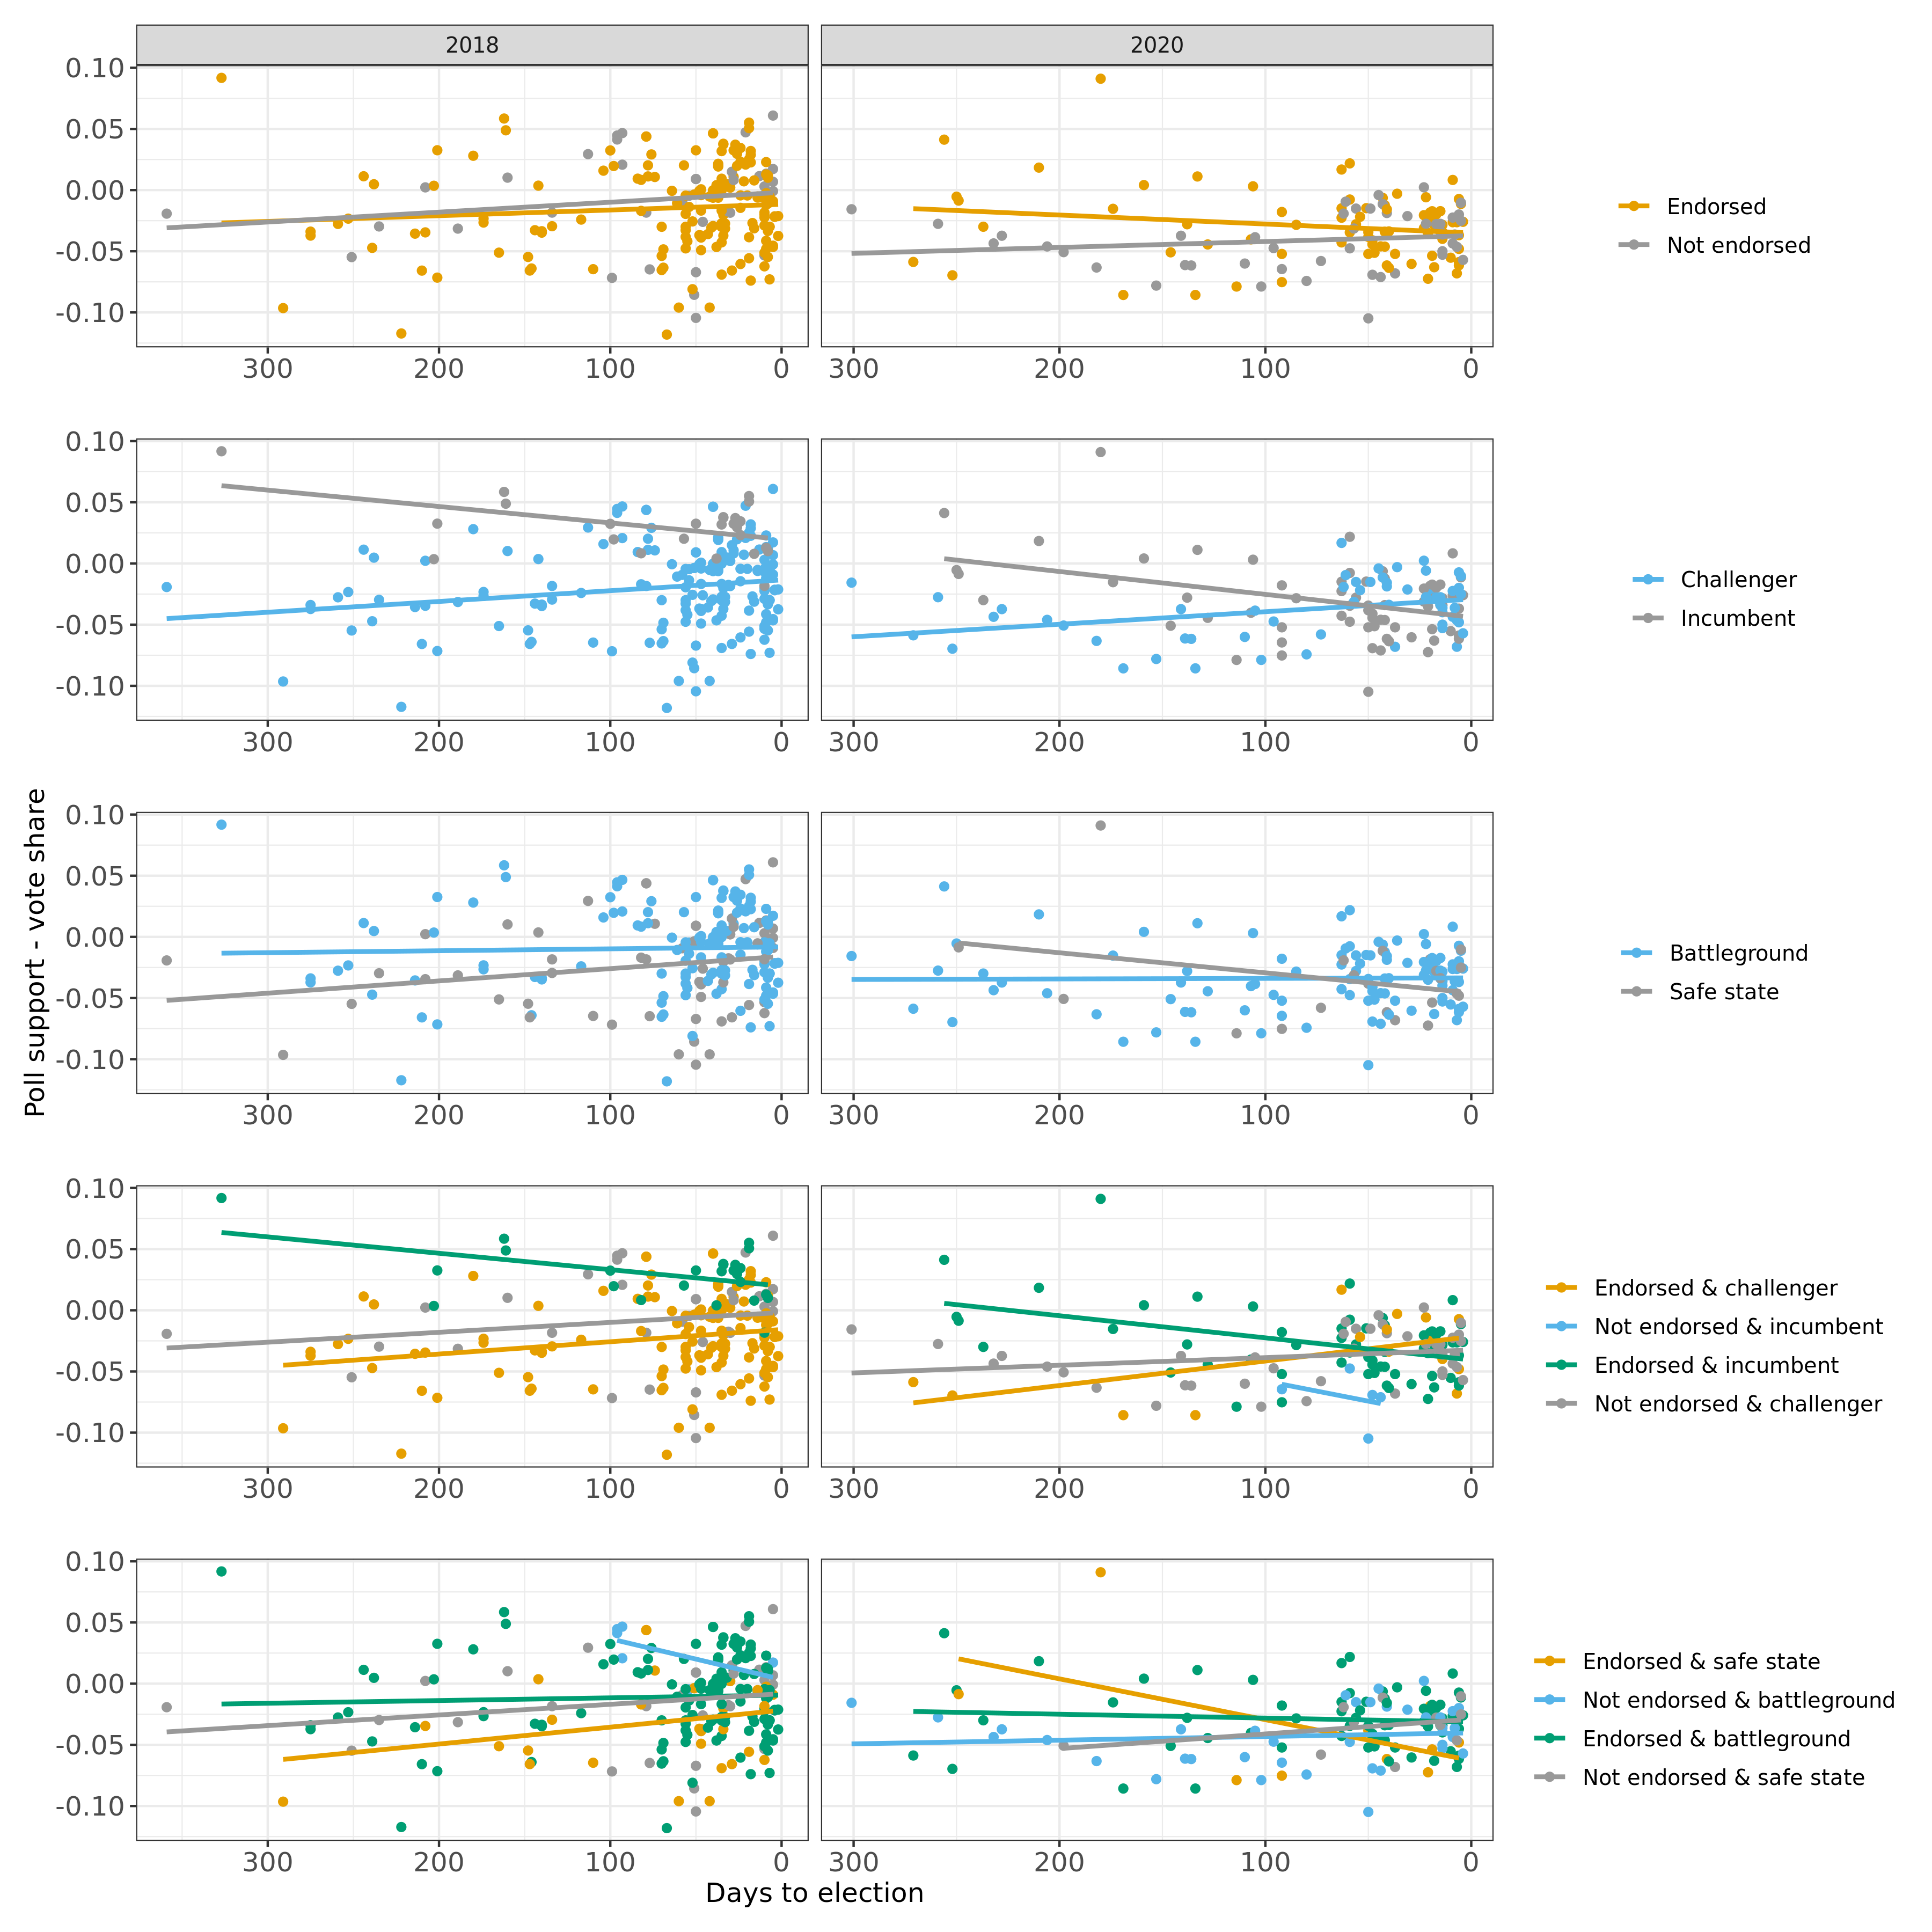 Figure 4: Republican two-party poll support minus Republican two-party election vote share over time by endorsement, incumbency, and battleground state. Positive values indicate an overestimation, negative an underestimation of the actual vote share.
Model specification
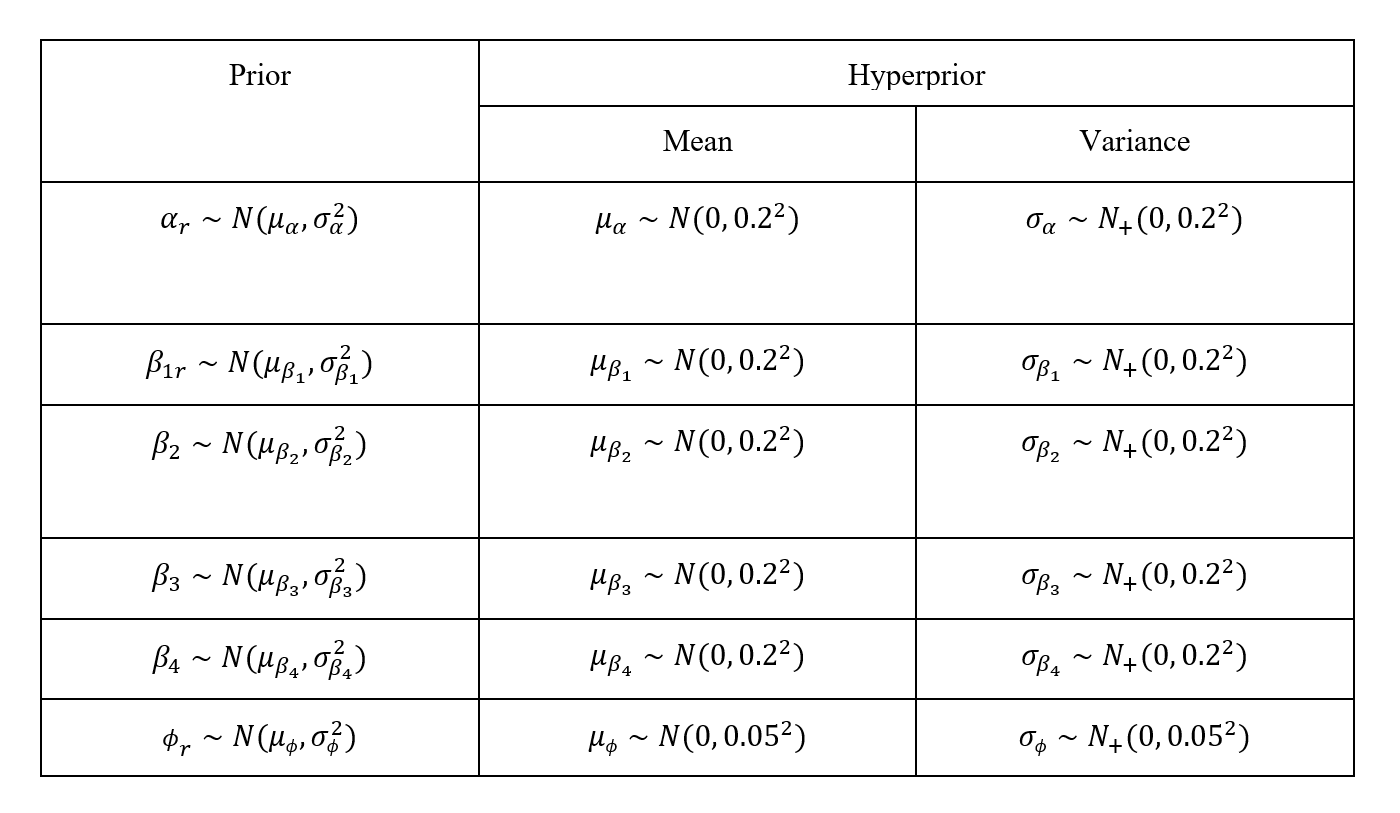
Table 1 reports the priors and hyperpriors for the models we describe in the main text. Priors are chosen which allow up to 5% bias (0.2 on the logit scale) and variance (0.05 on the log scale).
Table 1: Definition of priors and hyperpriors.
Results: Average election day bias
Figures 5 and 6 report the average election-level election day bias for different models:
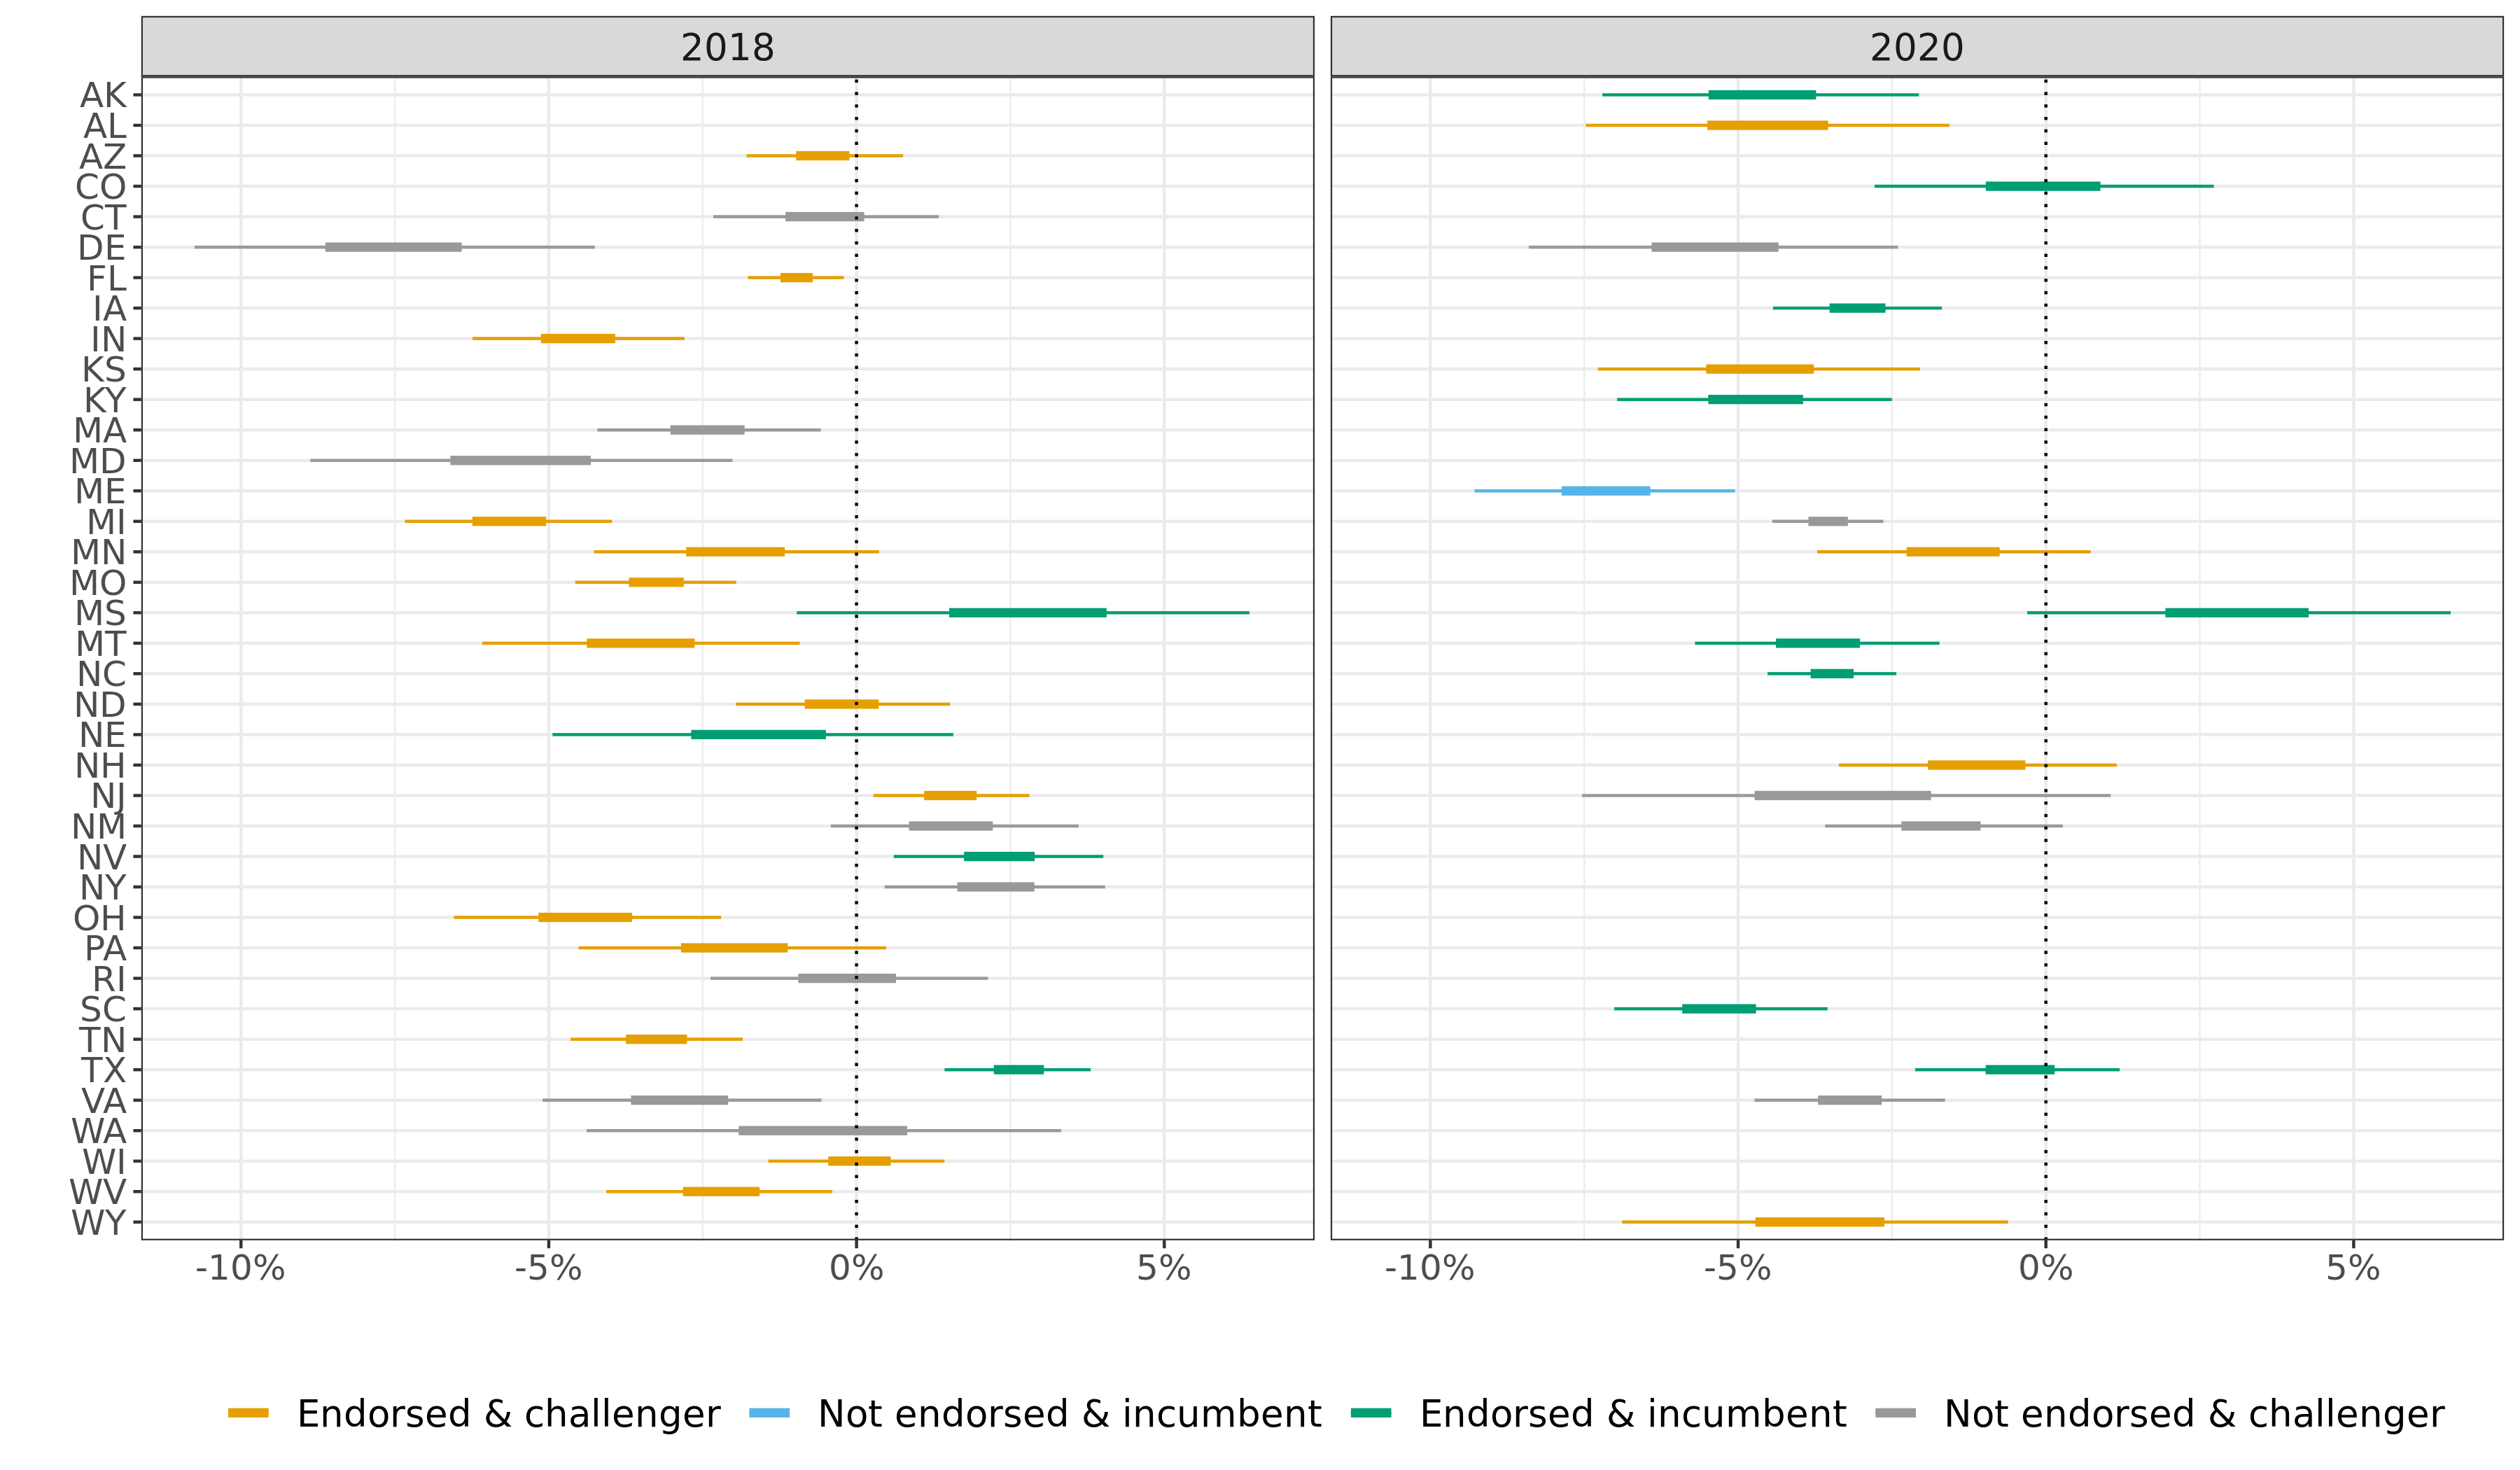
Figure 5: Estimated average election-level bias on election day of the endorsement and incumbency model. Negative values indicate that polls on average underestimated election results. Thicker horizontal lines represent the 50% credible intervals, and thinner lines the 95% credible intervals. Note that due to absence of polling data, not all states are shown.
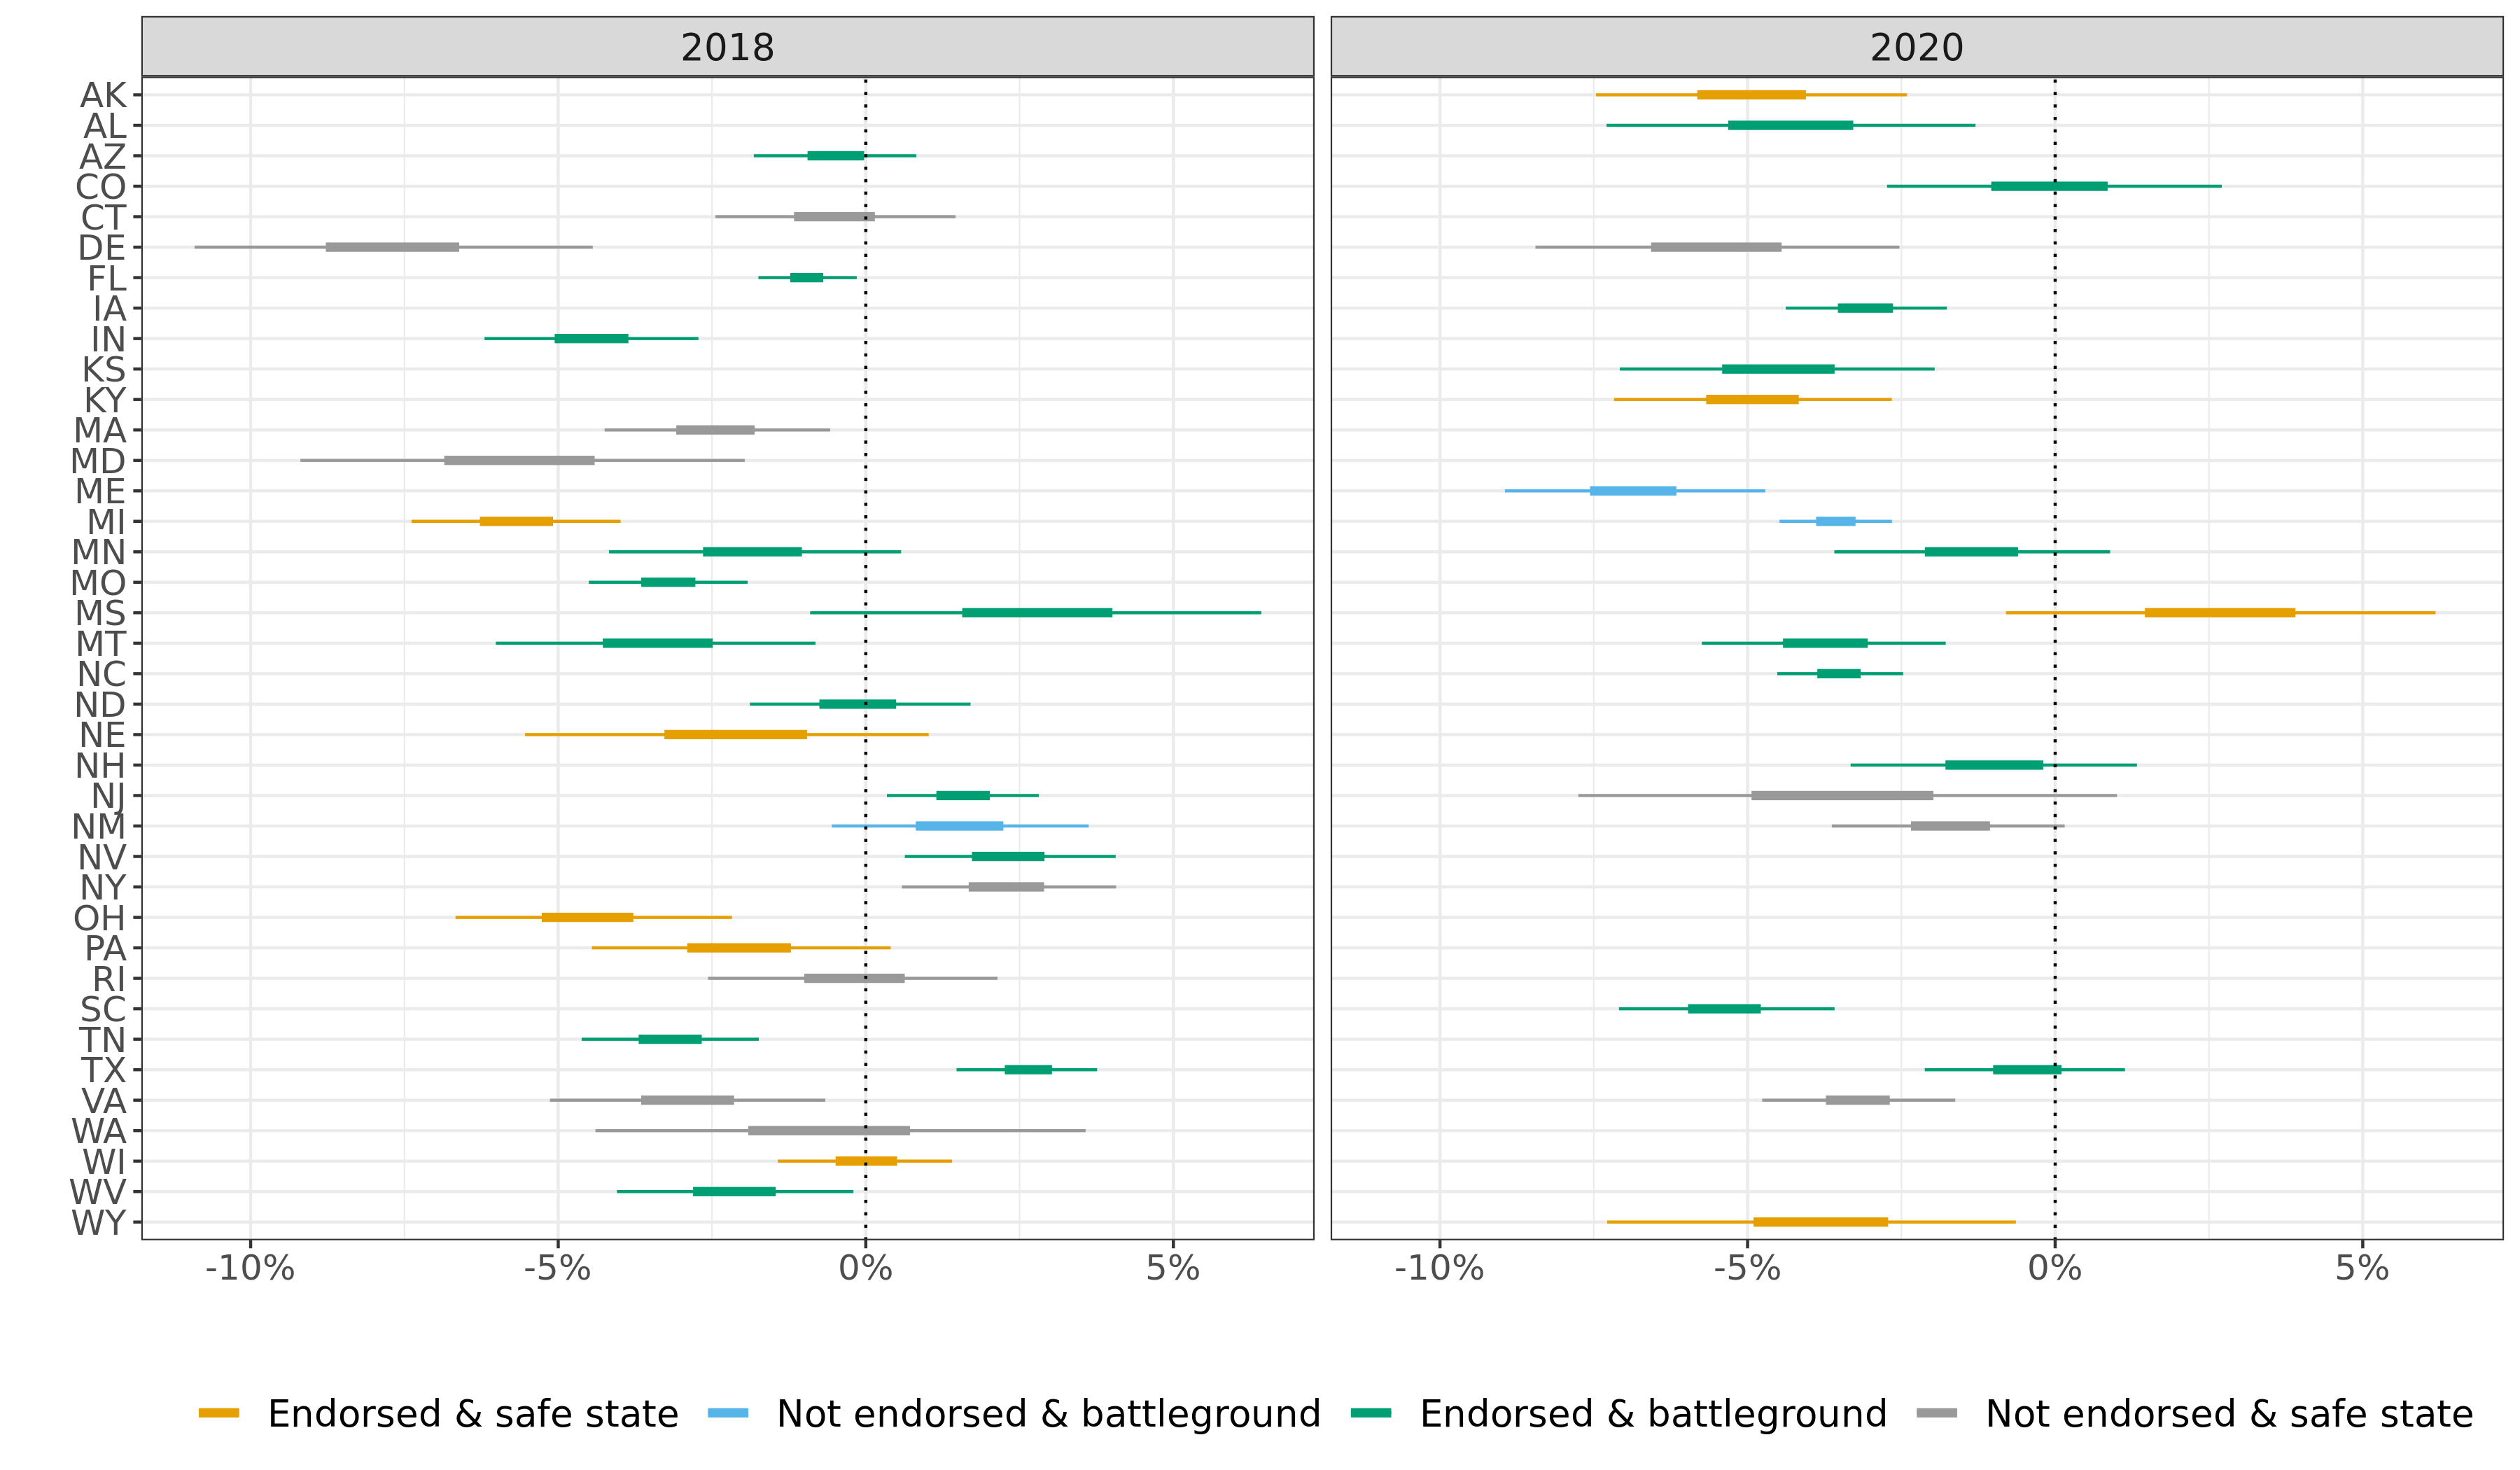
Figure 6: Estimated average election-level bias on election day of the endorsement and battleground model. Negative values indicate that polls on average underestimated election results. Thicker horizontal lines represent the 50% credible intervals, and thinner lines the 95% credible intervals. Note that due to absence of polling data, not all states are shown.
Results: Mean posterior estimates of election-level poll deviation from the election outcome, election day bias and standard deviation
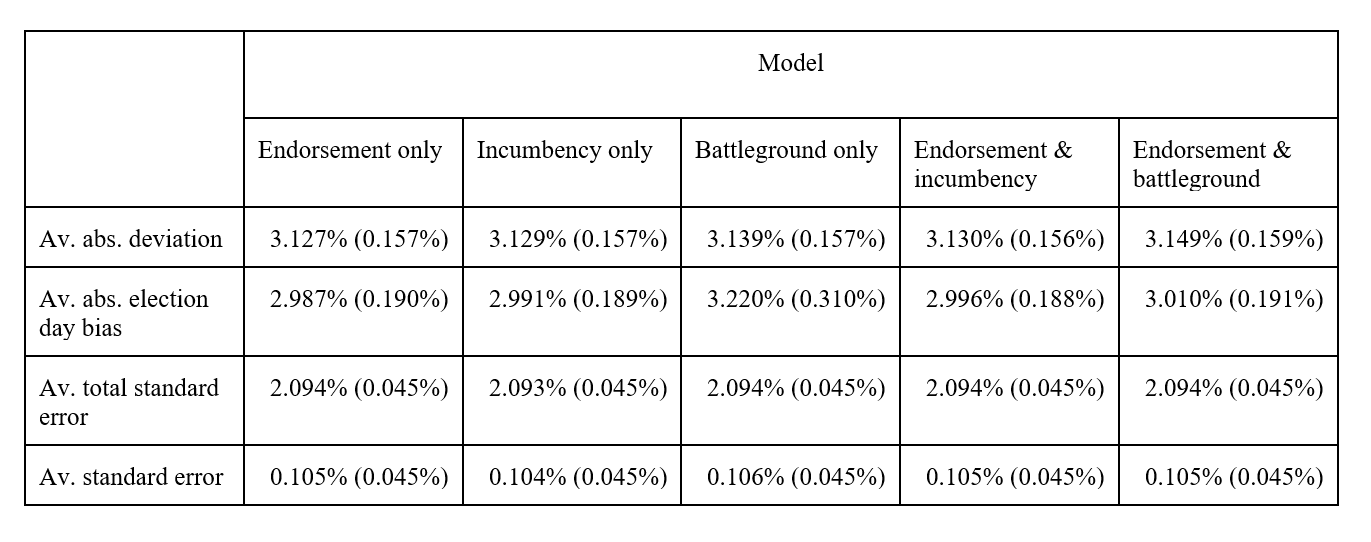
Table 2 reports mean posterior estimates of the average absolute election-level deviation from the election outcome, the average absolute election-level bias on election day, the average election-level total standard error and the average election-level standard error. Standard deviations are given in parentheses.
Table 2: Mean posterior estimates of average absolute election-level errors.
About the authors
Sina Chen is a PhD candidate at the Graduate School of the Social and Behavioural Sciences at the University of Konstanz.
John Körtner is a PhD candidate at the Swiss Graduate School of Public Administration (IDHEAP) at the University of Lausanne.
Editor’s note
See the June 2022 issue of Significance for Chen and Körtner’s article: https://rss.onlinelibrary.wiley.com/toc/17409713/2022/19/3


