

A host nation (as with a home team in league sports) is expected to be more successful at home than away. In league sports, there are three obvious advantages to playing at home. First, there is a physiological advantage of not having to travel as far as the visitor. Second, the home fans present a psychological advantage as they cheer on their team in greater numbers than visiting fans. Third, a tactical advantage ensues because the home team is more familiar with the venue.
Being chosen as an Olympic host nation provides yet more advantages, but only if these advantages are exploited in the years between a country’s selection and its hosting of the Games. For example, patriotic fervor ought to be an inducement to young athletes to pursue sports in greater numbers than before, increasing the pool of possible Olympians. Also, thanks to host-nation automatic qualifying, more teams and individuals are eligible to compete for an Olympic host nation and, for the teams and individuals that would have competed anyway, they are spared the fatigue of qualifying competitions around the world. Newly-included teams and individuals may rise to the challenge of acceptance and earn medals. The host nation must also build infrastructure to support sports, to identify promising athletes, to provide transportation to fans, and to build new venues and training centers.
Having been chosen as a future host nation, we would therefore expect to see the chosen country make some modest gains in medal count four years before hosting. We would then expect to see major gains during their host year, and then a possibly reduced medal count in the years after hosting, as the huge sums and services spent as host nation prove unsustainable. So the fact that Team GB added to its medal haul after London 2012 was unexpected. But how does its performance compare to other former host nations?
Host nation medal progression
The medal counts in Table 1 (below) are taken from a Wikipedia article as of 1 September 2016, which adjusts for medals which were stripped by action of the International Olympic Committee and then re-awarded. Stripped medals are listed in a separate article.
Each row in Table 1 shows the medal progression of a host nation over a 16-year window of five Games: eight years before hosting, four years before hosting, host year, four years after hosting and eight years after hosting. The right part of each row includes the four incremental changes from -8 years to -4 years as host, from -4 years to host year, from host year to +4 years, and from +4 years to + 8 years.
Table 1. Progression of medals won by host nations at Summer Olympics, post-World War 2. Each row contains the data for a host nation before, during and after hosting – from eight years before to eight years after. Entries in red, blue and green denote data specific to the 2008, 2012 and 2016 Olympics, respectively.
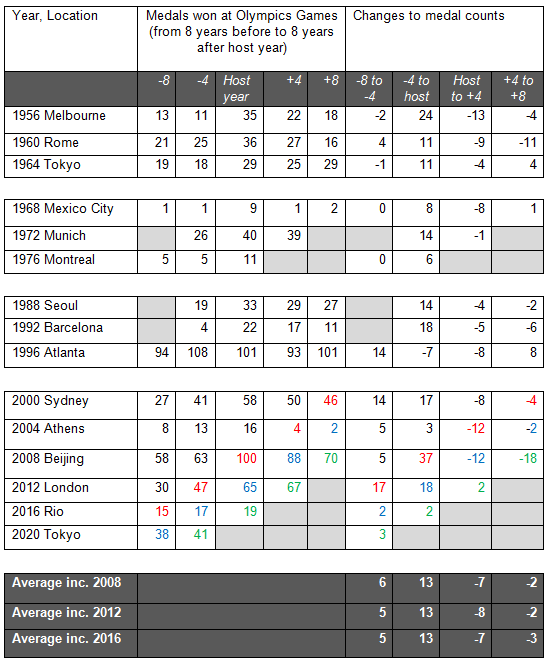
Pre-World War 2 medal counts would be under very different conditions, economically and socially, compared to post 1948, thus these are not included. The table includes most but not all host nations since the Games resumed in 1948. The 1948 Games were not fully attended, making a comparison with host nation Finland’s medal count in 1952 non-meaningful. The Soviet Union re-entered the Games in 1952 so that Australia’s medal count as host nation in 1956 occupies the first row, as there was a reasonably comparable level of international competition compared to that in 1952. The only datum from 1948 is for the 13 medals won by Australia eight years before hosting in 1956. Two other host years are problematical and are not included: 1980 and 1984, due to boycotting. The only datum included from these years is the 19 medals earned by South Korea in 1984, so that value could be compared with the 33 medals South Korea earned as host in 1988.
One other datum is excluded. From 1956-1984, West Germany and East Germany were allowed to compete as a unified team (EUA), much as the Soviet Union did in 1992. The medal count earned by the EUA in 1964 was not included, as that value is not comparable to medals earned by Germany as a separate entity in the period surrounding its hosting of the Munich Games in 1972.
In an earlier study, published prior to the 2012 Games, we tried three linear regression models in an effort to find a useful model with a reasonable fit between medals earned four years before hosting and those earned as host, using then-available data. The first model was a multiplicative constant acting on the medals earned four years before. The best multiplier was 1.19, resulting in an average absolute error (AAE) in smoothing of 12.3 medals. Next, the best additive constant was found, which proved to be 13 medals (AAE = 7.7). Lastly, the best first order regression model resulted in a multiplier of .95 and an additive constant of 14.5 medals (AAE = 7.6 medals). As the additive constant is simpler and has about the same AAE as first order linear regression, simple averages were used thereafter.
Averages are found in this study for all four increments in Table 1, inclusive of the 2008 Olympics, inclusive of the 2012 Olympics and inclusive of the 2016 Olympics, where red indicates data for the 2008 Olympics, blue denotes 2012 and green denotes 2016. The average gain in medals from 4 years before hosting to hosting are, in each case,13 medals. There is some small amount of variance in the averages for the other increments, but inclusive of 2016, the typical host nation gains 5 medals four years before hosting and then 13 more as host for a net gain of 18 medals over eight years. In the years that follow, the typical host nation wins seven fewer medals at its next Games and then another three fewer medals eight years after hosting, for a net gain of eight medals over 16 years. This is what we might consider to be the nation’s Olympic hosting legacy. With this data, we can now place Team GB into perspective.
Measuring Team GB’s hosting legacy
Figure 1 shows the four nations that were the most successful in terms of cumulative medal gain in the 12-year period that followed their selection as host. Australia appears twice, once as the host nation in 1956 and then again as host nation in 2000.
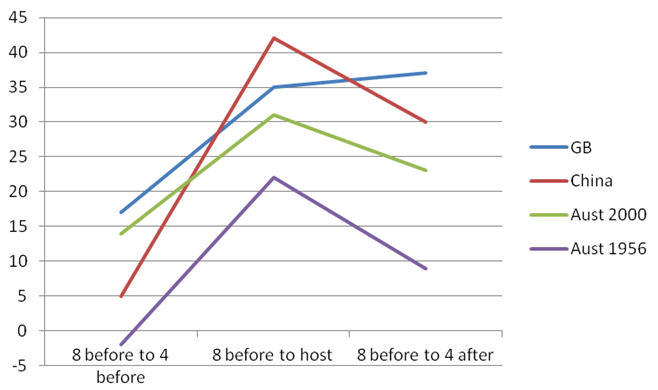
Figure 1. Cumulative medal gain for the most successful host nations, from eight years before hosting to four years after hosting.
From eight years before hosting until four years prior to hosting Team GB got off to the fastest start with a gain of 17 medals, just ahead of Australia’s pre-2000 gain of 14. This was a remarkably efficient response on the part of Team GB to the announcement of host-nation status. However, it was China that gained the most medals in the eight years from selection to hosting, adding 42 medals in total. In its host year, Team GB added another 18 medals to the 17 already gained for a net increase of 35.
Oddly, the USA is the only country in Table 1 to earn fewer medals in its host year than it did four years before – down seven medals from 1992 to 1996. There is a likely explanation for this. In 1992, the former Soviet Union competed for the last time as the Unified Team. East Germany ceased to compete after 1988. Beginning with 1996, many nations seized the opportunity to fill the void. The balance of power changed dramatically. Through 1992, the nation winning the most medals earned from 14-84% of all medals. After 1992, that top medal-winning nation only won 10-12% of all medals. Put another way, the top three medal-winning nations in 1992 earned an average of 100 medals compared to 76 in 1996, a drop of 24 medals. As the USA (one of the top three nations in both years) only dropped seven medals, there was still a host-nation advantage of sorts.
When we look at medal performance four years after hosting, we see that Team GB is the only nation in Table 1 to have gained more medals in its next Games. It added two to its total while China lost 12, and Australia similarly regressed after both host years. In addition, when examining the history of host nations dating back to 1896, we find that Team GB is the only host nation in modern Olympic history to gain more medals after hosting than it earned as host.
Over 12 years, Team GB has the greatest total medal gain (37), followed by China with 30 and Australia with 23 (in connection with the Sydney 2000 Games). How did Team GB achieve this result when most nations lose medals after hosting?
How Team GB succeeded
An article by Tom Fordyce gives specifics of the amounts spent, personal stories of some of the athletes who were supported, and a summary of the general planning that went into Team GB’s stewardship of their Olympic host nation legacy. A graph shows an obvious correlation between money spent and medals earned. The graph shows that financial support for sports began to increase from 2004, accelerated through 2012 and then increased a bit more post-2012. The article indicates that the amount spent per year from 2012 through 2016 amounted to £1.09 per person in Great Britain. In effect, a four-year expenditure of just over £4 per person “bought” 67 medals – more than twice the medal count of 2004.
No detail was overlooked in planning. One study of 400 elite GB athletes focused on sleep habits. Bedding material was optimized to increase sleep for boxers by about 24 minutes per night. A second study examined problems that female cyclists reported with debilitating saddle sores. The team’s solution eliminated saddle sores in Rio. Another study focused on maintaining psychological clarity when suffering from fatigue. The women’s hockey team underwent that training with the result that the team kept its cool and won gold in a shoot out against the heavily favored team from the Netherlands.
The article points out that in 2016, Team GB won its first gymnastics gold and its first diving gold. Altogether, medals were won in 15 different sports by a total of 129 Team GB athletes.
Predicting medals
The average incremental gains from Table 1 can be used to predict future medals for four nations: the nation that is four years away from being host, the host nation itself, the nation that was host four years ago, and the nation that was host eight years ago (see Table 2, below).
Table 2. Predicted medal count based on Table 1 averages (P=Predicted, A=Actual, E=Error (A-P)).

The middle two sets of predictions (for host and host +4 years) were previously reported prior to the 2012 Games and in the weeks that followed the London Olympics. The prediction errors were basically equal and opposite. In 2012, Team GB and China were expected to earn a total of 153 medals and they did earn 153 medals. In 2016, Brazil and Team GB were expected to earn a total of 87 medals and they earned 86. For 2020, we can expect Japan and Brazil to earn about 66 medals total.
Looking at the accuracy of predictions, we see that the largest error is for China, which underperformed by 16 medals in 2016. The AAE is 6.6 medals for all eight predictions. In only two of the eight predictions did a nation win more medals than expected: in both cases that nation was Team GB.
Predictions for the Tokyo Olympics of 2020 are shown, except that the host for 2024 has yet to be chosen. That host will be chosen in September 2017 from among Budapest, Hamburg, Paris, Rome and Los Angeles. The selected nation should win five more medals in Tokyo than in Rio.
Summing up
Team GB has achieved more with its legacy as host nation than expected in recent Games and may well do so again in 2020. Continued planning, continued support and the momentum of 129 medal winners should carry Team GB onward to another successful Olympics, possibly surpassing China with the second-most medals won.


