
Football fans say a team plays better in their home stadium, thanks to the familiarity of the environment and the quantity of fans cheering them on. The August 2021 issue of Significance published an article entitled No fans, no home advantage? which examined this phenomenon and the impact of Covid restrictions in the 2020/21 season. Here, Alan Jackson continues and extends his analysis to, among other things, look at what happened after the crowds returned in force
For the English Premier League football 2020/21 season, when fans had been absent or present only in very limited numbers, it did not seem to matter whether teams were playing at home or away, and that any possible stadium-related factors had no appreciable effect. In other words, there was no home advantage. And that home advantage in Premier League football appeared to be due solely to the support of the home fans.
This study extends the analysis to the lower three (non-Premier League) divisions; examines home advantage for the 2021/22 to 2024/25 seasons (when fans returned); and explores the effect of a team changing their home stadium.
All four divisions
The English Premier League was set up on 20 February 1992. For seasons 1992/93 to 2003/4, Division 2 was called First Division, Division 3 was called Second Division, and Division 4 was called Third Division. For seasons 2004/05 onwards, Division 2 was called the Championship, Division 3 was called League One, and Division 4 was called League Two. Because of these name changes during the Premier League era, and to simplify this counter-intuitive taxonomy, the four divisions will be referred to as the Premier League, Division 2, Division 3, and Division 4.
Does home advantage really exist or is it some kind of footballing myth? One way to establish whether home advantage exists in the English Premier League is to compare the ratio of home and away wins for different teams over a number of seasons. This is a fair approach as each team in the Premier League plays each other team once at home and once away. The top teams would have more wins than the lower teams; but, if home advantage does not exist, then at the end of a season and for each team, the number of home wins should be about the same as the number of away wins, however large or small they are. And if it does exist, is it due to the stadium or the cheering of the fans?
For the 2020/21 season, when fans had been absent, there was no home advantage
Until the 2020/21 season, it had not been possible to answer this question with any degree of certainty; however, for most of the season, fans were absent or present in very limited numbers because of Covid-19 restrictions. This meant the possibility of experimental determination of the reason for home advantage as the absence of fans was the only difference from earlier seasons.
The average home and away wins ratio for all the Premier League seasons before 2020 was 1.68. If the stadium factor were the sole factor then the ratio for the 2020/21 season would have been expected to be equal to (or close to) 1.68. If the home and away wins ratio equalled 1 (that is, the number of home wins and away wins were equal) then playing in a team’s home stadium or in away stadiums made no difference. The ratio for the 2020/21 season was 0.94; that is, there were slightly more away wins than home wins, but an unimportant difference.
This shows that for the 2020/21 season, when fans had been absent, there was no home advantage. It was therefore reasonable to conclude that home advantage in Premier League football is due solely to the support of the home fans. But what about the three lower divisions? Figure 1 shows the home wins to away wins ratio for the four top English divisions for seasons 1992/93 to 2019/20 when fans were present, and separately for season 2020/21 when there were no fans.
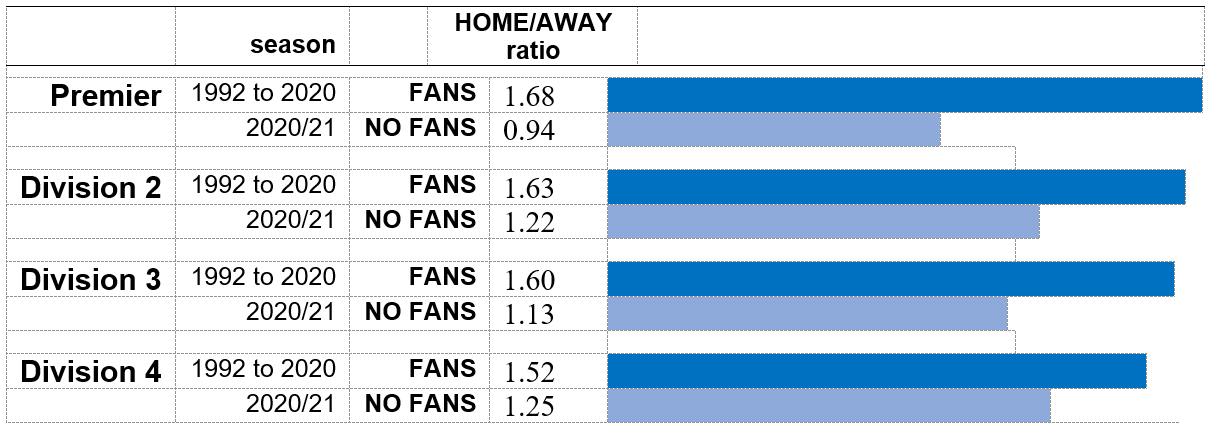
Figure 1: Ratio of home wins to away wins for the top four divisions for the seasons 1992/93 to 2019/20.
For the Premier League, the ratio of home wins to away wins decreased by 44 per cent for the seasons 1992/93 to 2019/20 when fans were present compared with the 2020/21 season when there were no fans. For Division 2 the decrease was 25 per cent; for Division 3 the decrease was 29 per cent; and for Division 4 the decrease was 18 per cent.
Figure 1 shows that for the seasons 1992/93 to 2019/20 there was a slight decrease in the ratio of home wins to away wins for the lower divisions. That is, home advantage still exists for the lower divisions but is slightly less pronounced the lower down the divisions a team plays. A possible explanation is that the crowds are much smaller in the lower divisions and that home advantage is a function of the number of fans.
Figure 1 also shows that for the lower three divisions in the 2020/21 season, when there were no fans, the home wins to away wins ratio was an average of 1.2; that is, home advantage decreased appreciably but did not completely disappear if there were no fans. A possible explanation is that pitches are more variable in size and quality in the lower divisions compared with Premier League pitches and so teams had a slight advantage playing on a pitch that they were used to.
The seasons 2021/22 to 2024/25
In the 2021/22 season, fans returned to the stadiums and Figure 2 shows the ratio of home wins to away wins for the four divisions for this season and the next three. For the three lower divisions, the ratios for 2021/22 to 2024/25 were broadly similar to the previous seasons when fans were allowed into the stadiums (with some variation). In 2021/22, the Premier League ratio of 1.26 was lower than in previous seasons but it still showed that there were more home wins than away wins (163 home wins and 129 away wins).
That the ratio was lower than the previous 1.68 average could simply be a random fluctuation. The ratio had varied from 1.4 in 2002, 2016, and 2019 to 2.1 in 2010. Also, if the top two or three teams tended to win nearly all their matches and if the bottom two or three teams tended to lose nearly all theirs then this would have the effect of reducing the home wins to away wins ratio. And this was a feature of the 2021/22 season. In the Premier League 2022/23 season, the ratio returned to its previous level.
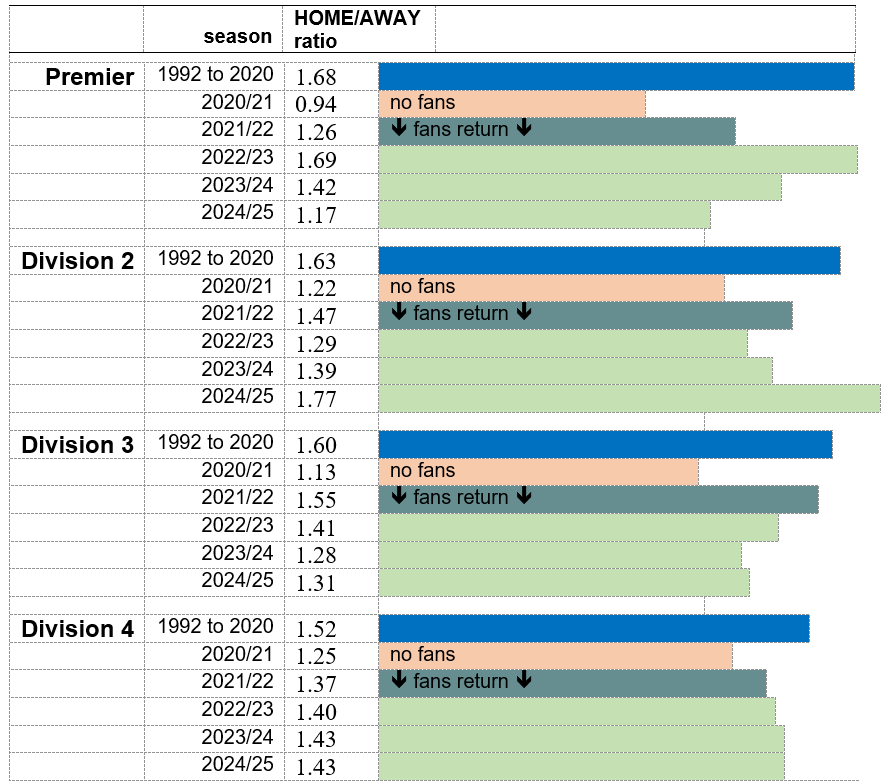
Figure 2: Ratio of home wins to away wins for the four divisions for the 2020/21 and subsequent three seasons.
Considering the ratios of home wins to away wins for the four divisions in the 2021/22 to 2024/25 seasons, it is reasonable to conclude that with the presence of the fans the home advantage had been restored.
Changing stadiums
During the lifetime of the Premier League, six teams have changed their stadiums: Arsenal, Leicester City, Manchester City, Southampton, Tottenham Hotspur, and West Ham United. Everton changed theirs for the 2025/26 season but it is too early to assess the effect.
If the presence of the home fans is the factor which confers home advantage, and not the familiarity of the home stadium, then the change of stadium should make no difference to the ratio of home wins to away wins, provided that the same fans attend both stadiums (a reasonable assumption).
The change of stadium should make no difference to the ratio of home wins to away wins
Leicester City moved from Filbert Street where they had been since 1891 to the King Power Stadium in 2002, and Manchester City moved from Maine Road where they had been since 1923 to the City of Manchester Stadium (usually referred to as the Etihad Stadium) in 2003. But both teams played in the lower leagues around the time of the stadium move so before-and-after comparisons are not valid.
For the other four teams – Arsenal, Southampton, Tottenham, and West Ham – comparisons have been made for the three seasons before and after the stadium move (ignoring the season at the time of the move).
Arsenal moved from Highbury, where they had been since 1913, to the Emirates Stadium in 2006. The following table shows that, for the three seasons before the move, the home wins to away wins ratio was 1.39 and, for the three seasons after the move, it was 1.48 (an insignificant increase).
Arsenal
| Highbury | Emirates Stadium | ||||||||
| 2002/03 | 2003/04 | 2004/05 | total | 2007/08 | 2008/09 | 2009/10 | total | ||
| Position | 2nd | 1st | 2nd | 3rd | 4th | 3rd | |||
| HOME wins | 15 | 15 | 13 | 43 | 14 | 11 | 15 | 40 | |
| AWAY wins | 8 | 11 | 12 | 31 | 10 | 9 | 8 | 27 | |
| Home/away | 1.9 | 1.4 | 1.1 | 1.39 | 1.4 | 1.2 | 1.9 | 1.48 | |
Table 1: Ratio of home wins to away wins for Arsenal during its seasons at Highbury compared to those at the Emirates Stadium.
West Ham moved from Upton Park where they had been since 1904 to the London Stadium in 2016. The following table shows that for the three seasons before the move the home wins to away wins ratio was 2.50 and for the three seasons after the move it was 1.69 (a small decrease).
West Ham
| Upton Park | London Stadium | ||||||||
| 1912/13 | 1913/14 | 1914/15 | total | 2017/18 | 2018/19 | 2019/20 | total | ||
| Position | 10th | 13th | 12th | 13th | 10th | 16th | |||
| HOME wins | 9 | 7 | 9 | 25 | 7 | 9 | 6 | 22 | |
| AWAY wins | 3 | 4 | 3 | 10 | 3 | 6 | 4 | 13 | |
| Home/away | 3.0 | 1.8 | 3.0 | 2.50 | 2.3 | 1.5 | 1.5 | 1.69 | |
Table 2: Ratio of home wins to away wins for West Ham during its seasons at Upton Park compared to those at the London Stadium.
Southampton moved from The Dell, where they had been since 1898, to the St Mary’s Stadium in 2001. The following table shows that, for the three seasons before the move, the home wins to away wins ratio was 2.70 and for the three seasons after the move it was 2.44 (an insignificant decrease).
Southampton
| The Dell | St Mary’s Stadium | ||||||||
| 1997/98 | 1998/99 | 1999/00 | total | 2002/03 | 2003/04 | 2004/05 | total | ||
| Position | 12th | 17th | 15th | 8th | 12th | 20th | |||
| HOME wins | 10 | 9 | 8 | 27 | 9 | 8 | 5 | 22 | |
| AWAY wins | 4 | 2 | 4 | 10 | 4 | 4 | 1 | 9 | |
| Home/away | 2.5 | 4.5 | 2.0 | 2.70 | 2.2 | 2.0 | 5.0 | 2.44 | |
Table 3: Ratio of home wins to away wins for Southampton during its seasons at The Dell compared to those at St Mary’s Stadium.
Tottenham moved from White Hart Lane, where they had been since 1899, to Wembley (temporarily) in 2017 and then to the Tottenham Hotspur Stadium in 2019. The following table shows that, for the three seasons before the move, the home wins to away wins ratio was 1.11 and for the three seasons after the move it was 1.48 (a small increase).
Tottenham Hotspur
| White Hart Lane | Tottenham Hotspur Stadium | ||||||||
| 2013/14 | 2014/15 | 2015/16 | total | 2017/18 | 2018/19 | 2019/20 | total | ||
| Position | 6th | 5th | 3rd | 3rd | 4th | 6th | |||
| HOME wins | 11 | 10 | 10 | 31 | 13 | 12 | 12 | 37 | |
| AWAY wins | 10 | 9 | 9 | 28 | 10 | 11 | 4 | 25 | |
| Home/away | 1.1 | 1.1 | 1.1 | 1.11 | 1.3 | 1.1 | 3.0 | 1.48 | |
Table 4: Ratio of home wins to away wins for Tottenham Hotspur during its seasons at White Hart Lane compared to those at the Tottenham Hotspur Stadium.
There is some variation between the four teams: two teams showed small increases in the home wins to away wins ratio, and two showed small decreases. These small variations are likely to be random fluctuations.
Figure 3 shows the aggregated home and away wins before and after a stadium change.
| old stadium wins | new stadium wins | ||||
| home | away | home | away | ||
| Arsenal | 43 | 31 | 40 | 27 | |
| Southampton | 27 | 10 | 22 | 9 | |
| Tottenham | 31 | 28 | 37 | 25 | |
| West Ham | 25 | 10 | 22 | 13 | |
| TOTAL | 126 | 79 | 121 | 74 | |
Figure 3: Aggregated home and away wins before and after a stadium change
The aggregated home and away wins ratio for the seasons before the stadium change is 1.59 and the ratio for seasons after the stadium change is 1.64. That these two ratios are virtually the same confirms the earlier finding that playing in different stadiums does not affect the chance of a team’s winning – provided the home fans are still present.
So what have we learned about home advantage?
Home advantage exists for all four divisions and it is likely to be due to the presence of the fans. Home advantage disappeared in the Premier League for the 2020/21 season when fans were absent due to Covid (and was reduced in the lower leagues) but was restored in 2021/22 and subsequent seasons with the return of the fans. If a team changes its stadium, the level of home advantage does not change much, which further confirms the conclusion that it is the presence of the fans which confers home advantage.
Note The associated report, Home and Away Annexe, contains all the raw data.
Disclosure statement The author has been a supporter of Liverpool FC since 1963.
You might also like: Which Premier League team has the most impactful fans?


