

Recent articles in the New York Times and The Economist cite the economics research of Geruso and Spears, who suggest that religion fully explains both: (a) differences in OD in India, and (b) consequently differences in childhood mortality. India is of particular interest for sanitation issues, given its super population size, combined with the fact that 60% of OD occurs in India.
These aggregate characteristics leave India flatly in the worst part of the distribution rank, among all countries. For example, when just looking at the 'population portion who OD' among nearly 215 countries, India ranks near the top decile. Where the higher the percentile, the worse the sanitation measure. And given India’s 18% share of the global population, when looking at the global population’s cumulative distribution function from population portion who OD, India takes up much of the top quartile.
The Geruso and Spears’ paper links differences in religion to differences in mortality, via differences in sanitation 'choices' that people make. Their work boldly states that religion causes these differences in choices.
Before analyzing their paper further, let’s look at another example to provide some context. If we move from the Indian sub-continent, to the African continent we can see that there is a large overlap between the many Christian-majority countries and the countries where there are more vegetarians. At the same time, there is a large overlap between the Islamic-majority countries, and the countries where there are more meat-eaters in the population.
So in Africa, does religion cause (or fully explain) people’s choices over whether or not to eat meat? It would be false to simply leap into that conclusion. An important theme, which recurs within probability and statistics, is to always assess what was 'left out of the story?'
The equator cuts from east to west across Africa, searing across countries that happen to be Christian-majorities. The equator’s climate allows for a cross-continent, agricultural path of vegetation that doesn’t exist elsewhere in Africa. What’s also 'left out of the story' was that these religious faiths elsewhere in the world don’t necessarily share the same uniform preference for meat-eating, as they have in Africa.
So what’s left out of the story is the idea that eating decisions might not be fully explained by ancient religion, but rather something possibly more complicated (taking into account multiple different factors). Finally, what’s left out of the story is the number of, and population and land mass of, different countries in Africa.
The lesson here is that whilst it was initially easy to leap into a conclusion concerning religion being the cause for African eating preferences, a deeper analysis suggests a different perception of the statistical variables may exist.
Now let’s return to the paper from Geruso and Spears. In looking at the global OD and religion data, it would be easy for a savvy statistician to solve the matrix algebra, for math sake. And doing so would simply show the obvious conclusion that the bulk of OD is associated with Hinduism. This trivial result is due to the state fact that India, with a high 18% of the world’s population, has both a majority share of this religion (80% of Indians are Hindu) and a large share of this country population portion who OD (48%). This is not a thoughtful analysis though, because of the statistical dynamics this narrow hypothesis leaves out.
Look at the the portion of the population who OD chart below. We show half of the six most populated countries worldwide. These three countries have the highest population sample size significance, for the rest of our research.
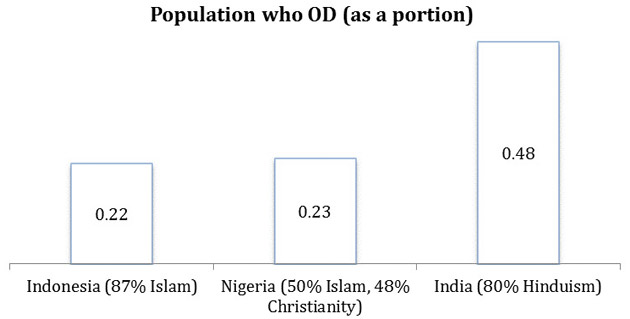
As we noted in the African meat-eating example, we must take a deeper look instead of just leaping to the conclusion that religion causes (or is an explanatory factor for) the portion of the population who OD. Certainly if one were to convert to Hinduism, they would not be instructed to grab a pail of water and run into isolation, off-grid, to practice OD.
So again, let’s delve deeper into our data. Let's look at the portion of the population who OD chart on the countries above, except now looking at their urban population only. The population sample sizes again are quite large. At 127m for Indonesia, 85m for Nigeria, and 391m for India. And these populations represent a large portion of each country’s population: 51%, 50%, and 32%, respectively. See the new portion of the population who OD chart below.
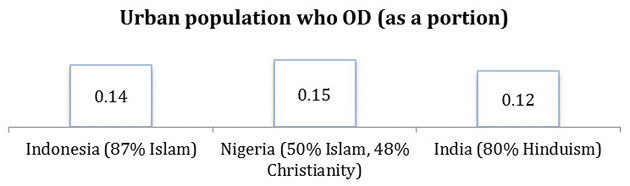
Suddenly the original, quick-hypothesis that religion fully explains OD, is now flipped up-side down. Now among the three countries, OD rates are higher on the populations of Indonesia and Nigeria. What was missing from the original hypothesis was the idea that the context plays an important role in determining sanitation, and not just one’s religion. Just as context played a large role in Africa, in suggesting who eats more or less meat.
Geographic settings around the globe are highly complicated. They are not easy to reduce to a handful of ancient religions explaining just about any current differences in human trends (in critical analysis far afield from health). This is a simple lesson that probability and statistics can teach us.
Let’s look again at OD, now considering multiple factors at once. We’ll leave religion out of this, since we already showed a couple times in this article that multicolinearity can confound information. It can provide what is essentially referenced as a Type 3 error in biostatistics: the probability of being right, but for the wrong reasons. Going forward, we should treat with suspicion any research headlines that runs off of one-factor explanations.
Let's take a look again at the portion of the population who OD by country, where we consider the difference in the rural population on the horizontal axis, and the urban population on the vertical axis. Of the 225 countries in the WHO dataset, some countries such as Eritrea have miscoded data errors (nearly full portion of the population who OD in their rural population, while they claim zero portion of the population who OD in their urban population). Ultimately 216 nations were examined. And the chart data below are harmonically scaled to represent the sample size of the urban and rural populations.
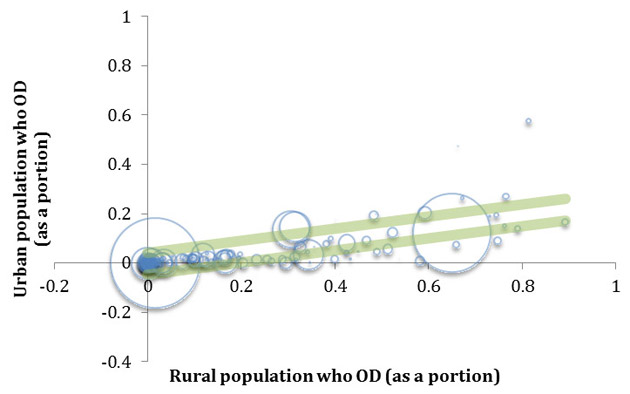
Despite the probability difficulty we previously noted, of reducing a large and complex country (e.g. India) into one stable statistical value, we show in green a linear regression confidence interval for one standard deviation (covering about 70% of the information).
This provides a singular, rough gauge of dispersion about the relationship. It shows one missed silver-lining from a policy perspective, which is the high probability that as India’s population becomes much more urbanized, they will likely see a quicker portion of the population who OD drop versus most countries. We can see India’s large data, near the right side of the bubble chart above, with an urban population portion of the population who OD of 0.12 (12%) on the vertical axis.


