
Our ancestors had only a sketchy understanding of who “they”, collectively, were. Enter demography: the statistics of human populations. Here, we celebrate the work of its earliest pioneers including John Graunt and Edmond Halley, as well as contemporary figures like Hans Rosling and Danny Dorling, and consider future challenges
It is over 15 years since the landmark and highly influential The Joy of Stats documentary featuring Hans Rosling was first broadcast on television. In it, Rosling, a Swede, tells us that in the early 18th century, after the Northern War that Sweden had been engaged in, there was a belief that the country’s population was 20 million, indicating the size of the pool from which soldiers could be drawn. Rosling, who died in 2017, comments: “Statistics tells us whether the things we think and believe are actually true”. He describes how the true figure of 2 million was derived in 1749 using the pioneering Tabellverket (‘Office of Tables’), “the first ever systematic collection of statistics – since the year 1749, we have collected data on every birth, marriage and death and we are proud of it”.
Sweden can lay claim to the world’s oldest regular national population statistics, but the groundwork was being laid almost a century earlier, in England.
Demography is defined by the Oxford Dictionary of Statistics as “The study of human populations, particularly with respect to births, marriages, deaths, employment, migration, health etc”. It often focuses on the composition and change in these areas. Demography originated through the publication of John Graunt’s 1662 book, Natural and Political Observations, Mentioned in a following Index, and made upon the Bills of Mortality.1 He was a draper by trade, with no scientific training, and it could be argued that his book gave birth to two sciences: not only demography, but statistics also.
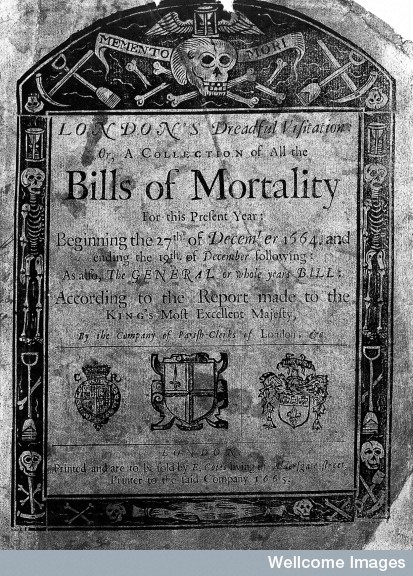
1665 Bills of Mortality report, reading: “London’s dreadful visitation: or, a collection of all the Bills of Mortality for this present year: beginning the 27th of December 1664 and ending the 19th of December following: as also the general or whole years bill. According to the report made to the King’s most excellent Majesty / by the Company of Parish-Clerks of London.” Public Domain Mark. Source: Wellcome Collection/Creative Commons
Graunt based his study on the ‘Bills of Mortality’ that were published weekly (Figure 1) and detailed parish christenings, burials and causes of death. Subscribers paid for a copy, including businesspeople who could use the information to plan for their trade or be primed to leave town if the plague threatened in London. Graunt encountered the challenge of using data that could be compromised by the way in which it was collected. The collectors were older women who visited the homes of those who had died to find the cause of death; they could be bribable, prone to drinking and their advanced age could compromise their data collection ability. However, Graunt saw the benefits of using the data anyway. Sex at death was recorded first in the data in 1629 and age not until the 18th century.
The perception of mortality and death before the publication of Graunt’s book was one of randomness, without pattern or prediction; the truth was derived from demography
Reversing even further back into history, demography experts also detect in Graunt’s work the influence of English philosopher and statesman Francis Bacon’s 1620 work Novum Organum, in which he recommends: “well arranged, and, as it were, living tables of discovery of these matters, which are the subject of investigation”.2
Graunt used proportional estimates to analyse the data and is regarded as the first to examine vital statistics in this way. He used tables to detail the information, eventually giving rise to the tabular statistics strand. Graunt found the population of London, using a multiplier method, where for example births or houses in an area are scaled up using an average to estimate a population. He used data for births, deaths and average house occupancy and each of his estimates for London’s population showed agreement around the 380,000 figure. Ultimately, Graunt showed that a population can be estimated if the number of deaths is accurately known. His analysis also enabled him to estimate the number of men currently of military age. He developed a life table, where he could estimate the survival to fixed age ranges from a cohort of 100 births, although it did not have an empirical basis but was purely hypothetical.
The perception of mortality and death before the publication of Graunt’s book was one of randomness, without pattern or prediction; the truth was derived from demography. Indeed, he used a geometric series in terms of deaths at certain age points, as he did not have age at death. Graunt found an underlying ratio of male to female births of 14 males to 13 females, whereas, before the book, the conventional view of the population was of three women to each man. He is accredited with the discovery of the fact that vital phenomena conform to laws when large numbers are considered. As American mathematical demographer and statistician Kenneth Wachter argues: “We are remote from the world of the [demography] founders. We struggle to recover a feeling for it through historical studies. But the world of the founders also lives on in us. We do their kinds of calculations”.3
Rosling believed that he was responsible for all the child deaths in the district, not just those in his hospital
Hans Rosling found himself in this very position working as a doctor in Mozambique in the 1970s, where the data for the district was patchy. Rosling believed that he was responsible for all the child deaths in the district, not just those in his hospital. He wanted to obtain the figures necessary for clarification, so he could devise an outreach programme. Rosling used the child mortality rate for Mozambique of 26%. Taken from census figures, he estimated the population of the district as 15,000: “So 26 percent of that number told us that I was responsible for trying to prevent 3,900 child deaths every year, of which 52 happened in the hospital. I was seeing only 1.3 percent of my job”.4
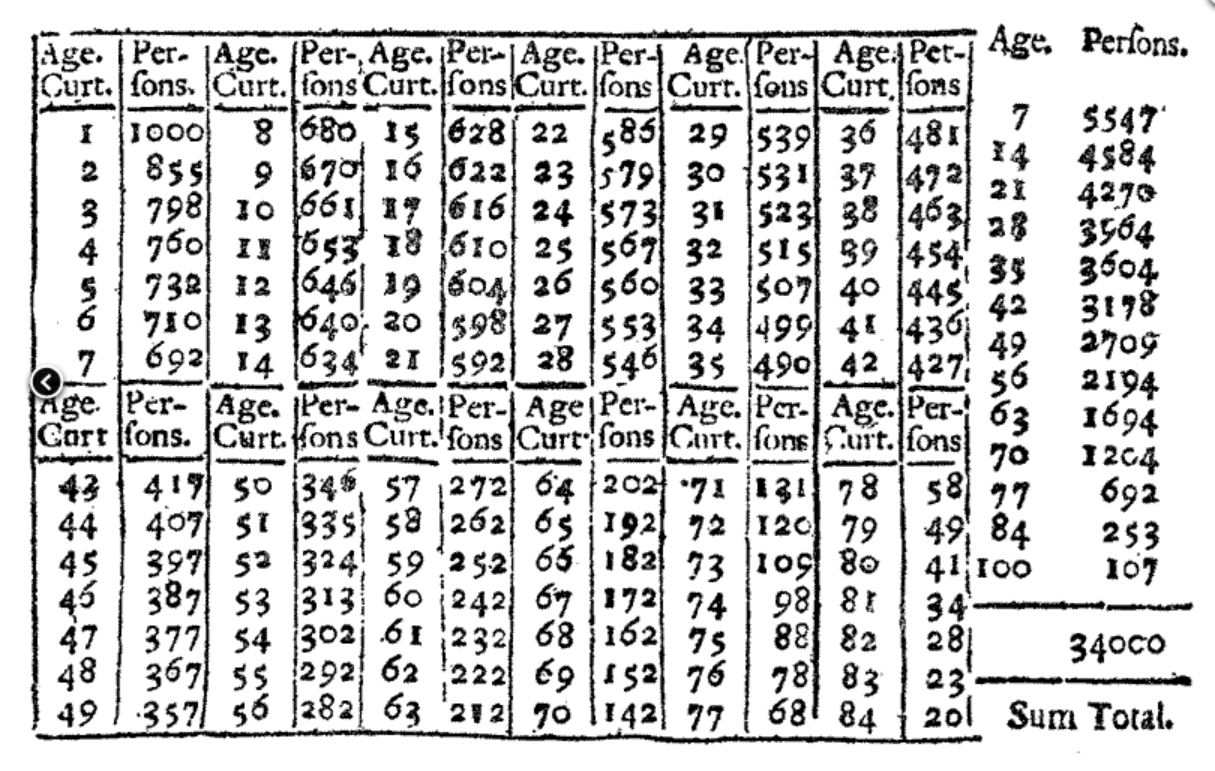
Figure 2: Table from Edmond Halley’s An estimate of the degrees of the mortality of mankind, drawn from curious tables of the births and funerals at the city of Breslaw; with an attempt to ascertain the price of annuities upon lives, 1693. Public Domain
The challenge of good data was first met by Edmond Halley (1656 – 1742). He was given demographic data which included sex and age at death from Breslau, then a city in Prussia, Germany, now Wroclaw in Poland. Halley produced a life table combined of male and female survivors, the first table based on accurate social data (Figure 2). He initially looked at his table to calculate the number that would be eligible for military service; Graunt did the same in 1662. Halley used the table so that life annuities could be matched to actuarial survival rates.
Stable population theory
Johann Peter Süssmilch (1707 – 1767) was an 18th century German demographer who followed in the footsteps of John Graunt. Süssmilch, who was also a Protestant pastor, believed in divine providence, and that the earth should be populated to the extent of God’s wish. He also used the same Breslau data Halley used and constructed a life table for Prussia, used in Germany and Europe well into the 19th century. Süssmilch found a very similar ratio of 1,050:1,000 for male to female births as Graunt did. He believed there was a divine explanation for the fact that, by the time of marriage, the ratio of male to female was close to equal – in reality, the excess of males was due to their propensity to work in dangerous conditions and involvement in military activity.
Euler modelled fixed age-specific birth and death rates to show a population grows geometrically in time, eventually resulting in a stable age structure
Graunt had sufficient data to evidence underlying ratios, but Süssmilch is credited with being “perhaps the first who clearly grasped the fact that when and only when sufficiently large numbers are taken into account, order and not accident appear”.5 Süssmilch published the 400-page Die göttliche Ordnung in den Veränderungen des menschlichen Geschlechts, aus der Geburt, Tod, und Fortpflanzung desselben erwiesen (The Divine Order in the Changes of the Human Species, as Demonstrated by its Birth, Death and Propagation) in 1741, and a two-volume second edition in 1761. The work is considered to have “broadened its field of investigation towards the economic and social interrelations of population development. Hence it was nearing the conception of modern sociologically based social demography”.6
The publication of Süssmilch’s second edition marks the beginning of stable population theory in the work of Süssmilch and Euler. Süssmilch knew Euler from their mutual membership of the Prussian Academy of Sciences and was particularly interested in the question of how quickly a population would grow if there was no check on it. Euler laid the groundwork for this, while geometric population growth was already seen by Süssmilch in his derivation of a rate of 125 births per 100 deaths. Euler modelled fixed age-specific birth and death rates to show a population grows geometrically in time, eventually resulting in a stable age structure.
Thomas Malthus (1766 – 1834) was an English economist who was strongly influenced by Süssmilch’s book. Malthus took issue with the charity of the English Poor Laws, which, combined with the constancy of the sex instinct, he believed to drive population increase. Combined with his perceived diminishing agricultural returns, this helped him to form his theory that population grew geometrically, while food production grew arithmetically. Malthus’ model raised more awareness of the nascent science of demography and the benefits to a nation of the recording and analysis of vital statistics. It also influenced politicians to introduce the first UK census in 1801.
Contemporary technique and forecasting
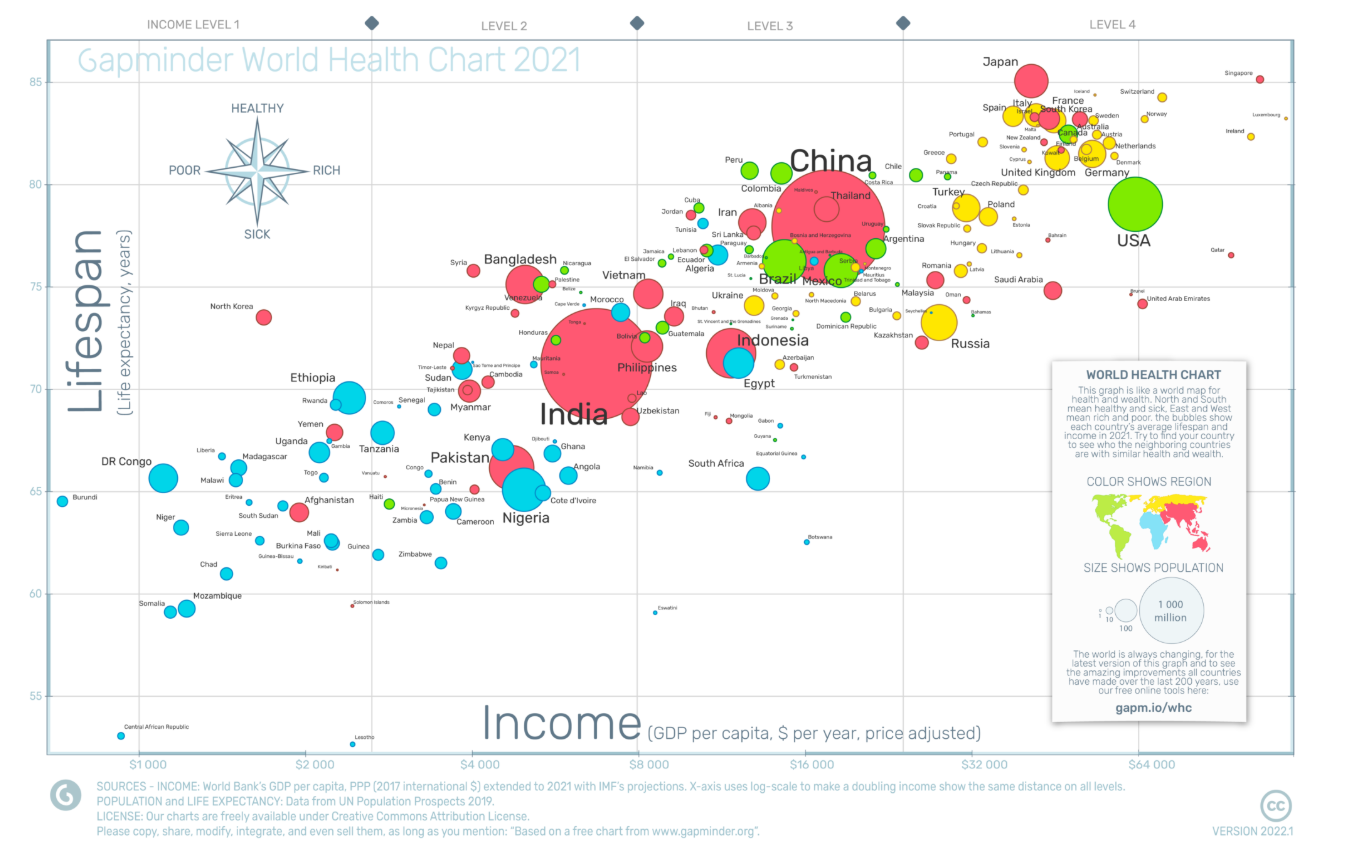
Figure 3: A bubble diagram by Hans Rosling, courtesy of www.gapminder.org/Creative Commons
Hans Rosling’s Gapminder Foundation created a circle-based animated graphical chart, where the bubbles were animated through time to visually show differences in wealth, health etc. (Figure 3). The effect is described to good effect by Rosling in his memoir: “I remember catching my breath and my eyes widening as the bubbles slowly, smoothly moved from illness and poverty in the lower left-hand corner of the graph, and up towards wealth and longevity in the upper right-hand corner”.7
In his 2013 book, Population 10 Billion (Figure 4), British professor of human geography Danny Dorling attempts to describe how 10 billion people can comfortably live on the planet.8 A population this big is not a certainty, he says, but a possibility. Hans Rosling, who died in 2017, also wrote optimistically about this expansion of population. Such speculations are not merely a modern concern. It was as far back as 1820 that William Godwin proposed the earth could sustain 9 billion people, in the first discussion about the earth’s population capacity. The previous century, Süssmilch had also discussed how agriculture and cultivation improvements could sustain higher population numbers – an issue that remains relevant to contemporary discussions of population growth.
The idea of the use of ratio in demography dates from Graunt. However, demography now relies on ratios that have more scope and are more sweeping in their insight potential and description. A case in point is the total fertility rate (TFR), the average number of children born to a woman in her lifetime. The TFR is falling worldwide, below the replacement rate of 2.1 births per woman, although some areas seeing a significantly higher figure. Overall, there is a projected stable global population of 10 billion in 2080, where population dominance switches to Africa. World population is still forecast to be 10 billion at the end of the century, although a TFR of –0.5 to 0.5 gives a variability between 6.5 to 14.5 billion. (Figure 4).
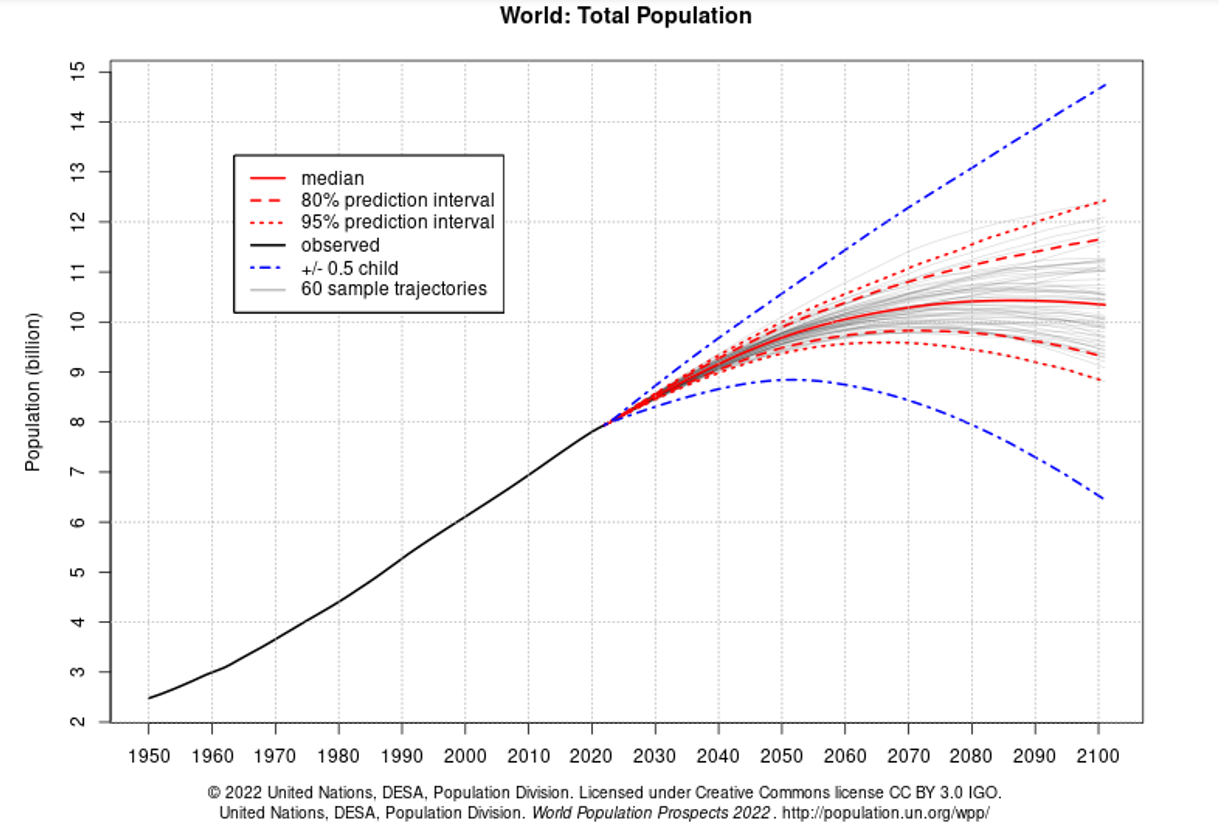
Figure 4: Total world population 1950-2100 forecast by the United Nations in 2022. Credit: United Nations Department of Economic and Social Affairs, Population Division/Creative Commons
The trend of population centred in Africa represents a global population shift. It has been predicted that by 2050 one in every four people in the world will live in Africa and that the continent has “the greatest potential for future demographic dividends”, given that almost 60 per cent of its population is aged under 25 and the median age is only 20.9 This ‘demographic dividend’ is predicated through the five-stage demographic transition model, a theory originally formulated by American demographer Warren Thompson in 1929. The model is based on the transition from high to low rates of birth and death as countries develop. The first stage is characterised by high birth and death rates; the final stage is where the birth rate falls below the death rate resulting in a decreasing population. Stage 3 of the model, in the middle, is where the demographic dividend is evidenced for Africa: the working age population predominates, giving greater economic earning potential. This predominance is enhanced by falling fertility rates, resulting in fewer very young people, and mortality rates are lower, yet there is an increasing but slowing population size. The life expectancy increase at stage 3 has yet to lead to a marked increase in the much older non-working population.
The ‘demographic dividend’ for Africa has implications for statistical readiness and planning. Interviewed for Significance magazine in 2025, the head of the United Nations’ African Centre for Statistics, Tinfissi-Joseph Ilboudo, discussed challenges that will impact on this readiness.10 The main issues, he pointed out, are a lack of the necessary technology, statisticians and data scientists: “Modernisation depends on digital tools, and unfortunately, many African countries still lack full access to the necessary technological infrastructure. Good internet connectivity and reliable digital tools are essential to increasing the efficiency and reach of statistical operations”. This is apparent in the current disparity in the use of digital census-taking technology across African countries. AI models, Ilboudo says, must be “trained specifically on high-quality, representative statistical data across the continent”.
Graunt, the founding father of demography, would surely have agreed.
References
- Graunt, J. (1977). Natural and Political Observations Mentioned in a Following Index, and Made Upon the Bills of Mortality. In: Mathematical Demography. Biomathematics, vol 6. Springer, Berlin, Heidelberg.
- Bacon, F. (1620). The New Organon. Edited by J. Devey. New York: P.F. Collier, 1902.
- Wachter, K.W. (2009) Order, Divine and Profane: A Reflexion on Petty, Graunt, Süssmilch, Euler, and Demography in 2012. Rostock: Max Planck Institute for Demographic Research. Süssmilch Lecture series in 2008/2009.
- Rosling, H., Rosling, O., & Rönnlund, A. R. (2018). Factfulness: Ten reasons we’re wrong about the world – and why things are better than you think. London: Hodder and Stoughton.
- C. H. Hull (ed.): The Economic Writings of Sir William Petty, 1899, Cambridge University Press, Vol. 2, pp.
314-431. - Horváth, R. A. (1991). Süssmilch’s Methodological Impact on European Statistics. International Statistical Review/Revue Internationale de Statistique, vol 59, no 1, 59-66.
- Rosling, H., Paterson, A. & Härgestam, F. (2020). How I Learned to Understand the World: A Memoir. London: Hodder and Stoughton.
- Dorling, D. (2013) Population 10 Billion: The coming demographic crisis and how to survive it. London: Constable & Robinson
- Short, J. R. (2024). Demography and the Making of the Modern World: Public Policies and Demographic Forces. Newcastle upon Tyne: Agenda Publishing.
- Alba, S. Interview: Tinfissi-Joseph, I. (2025). Reduced donor funding is more an opportunity than a threat. Significance. Vol 22, no 5, 33-35.
Wallace Ferguson is a retired teacher of mathematics and statistics and writes book reviews for the Institute of Mathematics and Its Applications.
You might also like: World population projections: Just little bits of history repeating? by Danny Dorling


