Is the Sage of Omaha an investment genius, or just incredibly lucky? In this winning article from the 2015 Young Statisticians Writing Competition, James Skeffington considers whether chance has played a hand in Warren Buffett’s success.
The year is 1965 and the American football season is about to begin. The week before the first game, you receive a mysterious letter from an unidentified sender. In the letter, the mystery man explains that he has an algorithm for predicting the outcome of football games. For a small fee, he promises to tell you, in advance, the winner of one game per week. Not only that, he promises that his picks will also beat the odds offered by the bookies in Vegas and on the high street (the spread), allowing you to profit from his all-knowing algorithm. Better still, the letter says: “The first 10 picks are free.” It sounds too good to be true. You toss the letter in the dustbin.
Later that week, the mystery man sends another letter. As promised, he picks a team to win and, sure enough, he picks correctly. You think to yourself, “no big deal”. After all, everybody has about a 50% chance of picking a winner any given week. He was just lucky.
After five weeks, you start to doubt yourself – all five of his picks have been correct. After ten weeks, you’re ready to sell everything and invest in this all-knowing algorithm.
Little do you know, you are not the only one receiving letters every week. The mystery man has mailed copious amounts of the same letters to other fans too. In half the letters, he picks one team to win; in the other half, he picks the opponent. It’s all random. There’s no algorithm, no rhyme or reason, just blind luck. The luckiest recipient just happens to be you.
A random walk down Wall Street
Also in 1965, Eugene Fama – a future Nobel Laureate – published a paper demonstrating that stock returns follow a random walk.1 The implications being that all those stocks your broker has been pushing may as well have been chosen at random.
That same year, Warren Buffett took his company, Berkshire Hathaway, public. Since then, he has grown his small textiles manufacturer into one of the largest conglomerates in the world. According to Buffett’s 2013 Annual Letter to Shareholders, Berkshire Hathaway averaged a 19.7% annual return when the stock market averaged just 9.8%. A thousand dollars invested with Buffett in 1965 is worth millions today.2
Buffett has outperformed every one of his competitors in one of the most high-stakes, hyper-competitive competitions on the planet. He is exceptional the same way a champion is exceptional – both outplayed the rest of the field. However, both are completely ordinary in another sense. Someone has to be champion, so why not Buffett? Even the football-letter scheme had a winner. Is it possible that Buffett just happened to receive all the winning letters? Is it possible that he isn’t the greatest investor of all time, but merely the luckiest?
Nobel Laureates like Fama have an answer to this question: Yes, it is possible. William Sharpe described Buffett as merely a “three-sigma event” (an extremely rare event).3 Merton Miller points out that “if there are 10,000 people looking at the stocks and trying to pick winners, well 1 in 10,000 is going to score, by a chance alone, a great coup, and that’s all that’s going on”.3
Buffett has taken the criticism from these fellow giants of finance in his stride, responding with trademark wit and humour. He even compared himself to an orang-utan flipping coins.3 Joking aside, this is a testable hypothesis: Is Buffett’s performance better than chance? To test it, we will stand on the shoulders of another giant: Jacob Bernoulli.
The shoulders of giants
The Bernoulli family are arguably the most accomplished group of mathematicians to ever walk the Earth. One member of the family – Jacob – is of special interest to us because of his work in the field of probability. In his seminal work, Ars Conjectandi, Jacob established the foundation for an idea which now bears his name – the Bernoulli process.4
The Bernoulli process describes random processes like tossing coins, rolling dice, and other games of chance.4 Associated with the Bernoulli process are a host of related concepts: Bernoulli trials, random walks, binomial distributions, binomial probability functions, etc. We can employ these concepts to mathematically model random events and answer questions like “what are the chances of landing three heads on three flips of a fair coin?”.
In our case, we can use the Bernoulli process to compare Buffett’s performance with that of chance. If Buffett’s results look sufficiently similar to those created by a Bernoulli process, then we have evidence that he is merely lucky. If the results look different, then we have evidence that he is more than just lucky, he’s good.
Playing the part of Buffett will be his company, Berkshire Hathaway. Playing the part of chance will be Buffett’s coin-flipping orangutan.
The Bernoulli trials
There are five variables in a Bernoulli process. We must first define values for each of them:
- the number of trials (represented by n);
- the probability of success (represented by p);
- the probability of failure (represented by q);
- the number of experiments (represented by x);
- the number of successes (represented by k).
We must tread carefully here. Cynics of statistics will point out that you can make numbers say whatever you want; all you have to do is change the underlying assumptions. That is certainly applicable here. Extreme choices can artificially transform Buffett into either an oracle or an orangutan. We would like our choices to be acceptable to the masses, not the extremes. So, in the Anglo-Saxon legal tradition, we will attempt to select values that a reasonable man would also choose.
First, the less contentious variables, most of which are defined by the Bernoulli process and can’t be changed without changing the underlying model. During each trial, the orangutan will flip a coin. He is flipping a fair coin so he has a 50% chance of success (p = 0.50) and a 50% chance of failure (q = 0.50).4 For simplicity’s sake, we will arbitrarily assign “heads” to the success category and “tails” to the failure category. Also, each flip will be independent of the previous flips.4 So, we will also assume that orangutans have not been trained in flipping only heads, nor do they know any special coin-flipping techniques.
We will conduct 49 trials (n = 49), one for each year that Berkshire Hathaway has been publicly traded. We could analyse monthly returns (n = 588), or weekly returns (n = 2548). The choice is somewhat arbitrary, so we will select the simplest measure, which is also an industry standard: annual returns.
The orangutan will not be flipping by himself, just as Berkshire Hathaway does not compete in a vacuum. So, our trials will include not one orangutan, but a whole rainforest full of them. Five hundred to be exact, one for each company in the Standard & Poor’s 500 Index (S&P 500) – an industry standard for “the market” (x = 500).
This is the most difficult variable to select. We know that there are 499 other competitors in the S&P 500, but what about all the other investors in the world – hedge funds, Dow Jones Industrials companies, individual investors, etc.? Counting them is practically impossible. We would have to include every investment opportunity, of every size and type, in every part of the world. Before long, we’re counting individual houses, heads of cattle, and lemonade stands.
To simplify, we restrict the scope of our analysis to just the S&P 500. This also restricts the breadth of our conclusions, but not their validity. At the end of the analysis, we cannot decide if Buffett deserves the title of “greatest investor of all time”, but we can decide if he deserves the title “greatest S&P 500 investor of all time”.
To measure Buffett’s performance, we will use Berkshire Hathaway’s annual percentage change in per-share book value versus the annual percentage change in the S&P 500 with dividends included, as published in Buffett’s 2013 Letter to shareholders.2 There are a number of alternative measurements, each with their own merits and demerits. For example, we could use risk-adjusted returns, or compare Berkshire Hathaway’s performance with the Dow Jones Industrials instead of the S&P 500. But annual returns versus the S&P 500 is an industry standard, and is also the simplest measurement which will also achieve our purpose.
Our simple model has now become a bit more complex and narrow in scope, but that’s to be expected – financial markets are complex phenomena and can’t easily be boxed into a simple analysis. Regardless, we’re now ready to begin flipping coins.
The battle begins
For the first trial, all 500 orangutans simultaneously flip their coins. Half the orangutans flip heads and half flip tails. Put differently, 250 orangutans have won 100% of the time, so they have a win proportion of 1.00. The other 250 have won 0% of the time, and have a win proportion of 0.00.
All 500 orangutans flip again during the second trial. They get the same result: half flip heads and half flip tails. Now though, the distribution of win proportions is different: 125 orangutans have flipped heads twice (1.00); 250 once (0.50); a third group of 125 still hasn’t won yet (0.00).
After the third trial, all 500 orangutans flip again with the same result: half heads and half tails. Table 1 displays the distribution of win proportions after three trials.
| Number of orangutans with given winning proportion | |||
| Win proportions | Trial 1 | Trial 2 | Trial 3 |
| 1.00 | 250 | 125 | 63 |
| 0.67 | 0 | 0 | 187 |
| 0.50 | 0 | 250 | 0 |
| 0.33 | 0 | 0 | 187 |
| 0.00 | 250 | 125 | 63 |
| TOTAL | 500 | 500 | 500 |
Table 1. Distribution of win proportions after three trials
Forty-nine trials later, the distribution of wins looks similar to the “bell curve” in Figure 1. Most orangutans have won about half the time and have a win proportion near 0.50. Some orangutans have won more than average and are immediately to the right of the centre of the curve; some have won less than average and are immediately to the left. A select few have won or lost a lot and are near the tails.
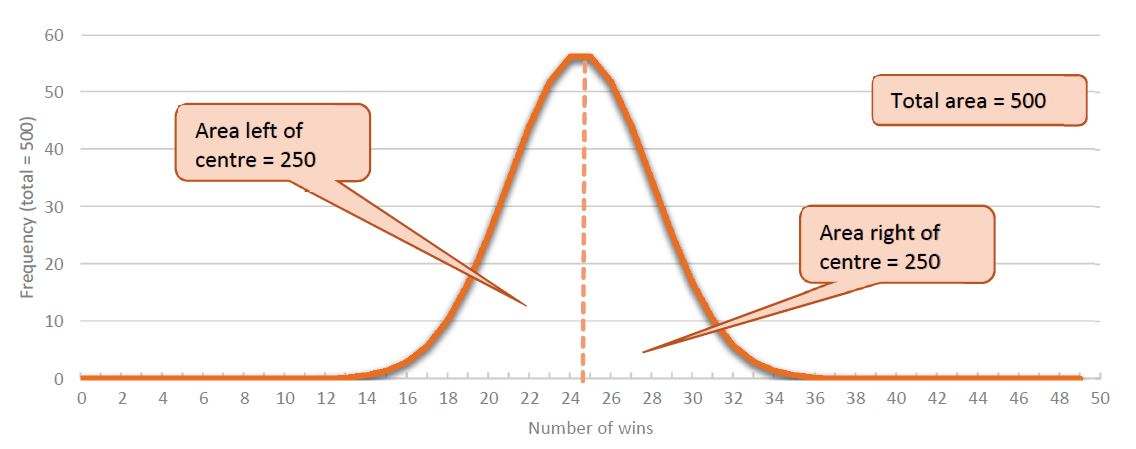
Figure 1. Distribution of wins after 49 trials
The sum of the values on the graph is 500 – the total number of orangutans in the study. The sum of values to the right of the centre line is 250 – exactly half of the 500 orangutans. The same for the left side.
But what if we are interested in extreme values like 49 wins? How many of our 500 orangutans would be expected to win every coin toss? That value is located on the far right of the curve and is very hard to discern with the naked eye. We can tell its value is very small, but we can’t tell how small. To figure it out, we’ll climb back onto Bernoulli’s shoulders and employ a cumulative binomial probability formula.
The cumulative binomial probability formula is a method of calculating probabilities in a Bernoulli process.4 But we can adapt this formula and use the cumulative distribution function of a binomial random variable to calculate expected values. If K denotes the random variable counting the number of successes, each of them occurring with probability p, and q = 1 – p is the probability of a failure, the probability of observing at least k successes in n trials is:

Multiplying this probability by the number of orang-utans in our trial (500) then gives us the expected value for the number of orang-utans winning k coin tosses. We will demonstrate with an easily verifiable illustration: we will calculate the expected number of orangutans flipping heads at least half the time (25 heads). We already know from the graph that the answer is 250. To verify the result, we’ll simply plug in the already-defined variables and chug away with our scientific calculator:

As expected, there are 250 orangutans who flipped heads 25 times or more. To determine the expected number of orangutans with 49 wins, we replace k = 25 with k = 49 and recalculate:

This is a very small number indeed, and so close to zero that we shouldn’t expect any of our 500 orangutans to win 49 out of 49 times. If we did find an orangutan that won all 49 times, we would know it wasn’t due to chance alone.
The same goes for the S&P 500: assuming that stock returns are random, and that shares are just as likely to go up as down, we would expect none of the 500 companies that make up the index to have beaten the market in all 49 years.
And the winner is…
But that’s enough explanation. This is a competition and it’s time to determine the winner. Warren Buffett didn’t beat the market in all 49 years; he beat the market 39 out of the past 49 years. So, we need to work out the expected value for the number of orangutans flipping heads in at least 39 out of 49 trials. On our graph, we’re looking at the area to the right of 39 (see Figure 2).
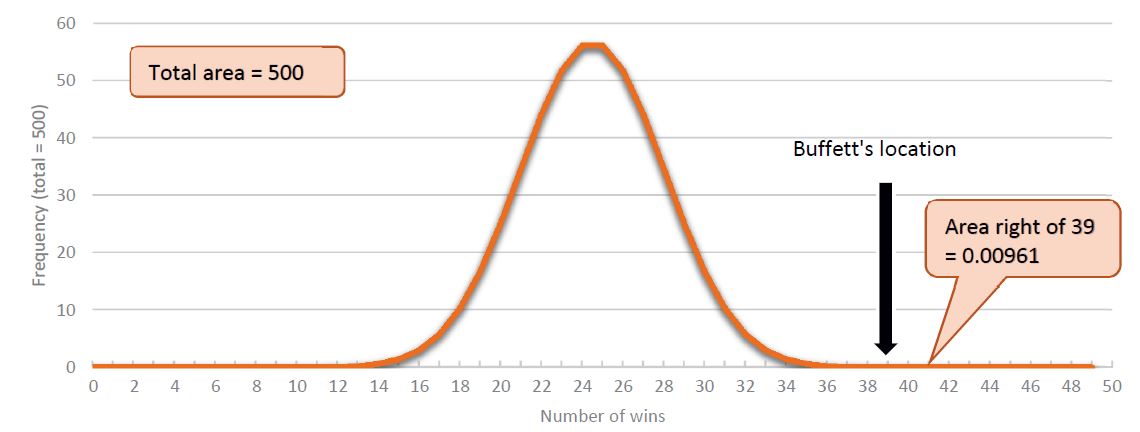
Figure 2. Frequency of wins after 49 trials, with Warren Buffett’s location
Again it is a very small number, but we can use our formula to calculate its value:

The expected value is much smaller than 1, so we can conclude that Buffett is a better investor than the luckiest orangutan. If stock returns really do follow a random process – as Eugene Fama asserted – then Warren Buffett is more than just lucky. Compared with his competitors in the S&P 500, he’s brilliant.
References
- Fama, E. F. (1965) The behavior of stock market prices. Journal of Business, 38(1), 34–105.
- Buffett, W. (2014) Annual letter to shareholders, 2013. Berkshire Hathaway. bit.ly/1g0xVxs
- Price, J. and Kelly, E. (2004) Warren Buffett: Investment genius or statistical anomaly? Paper presented to the First International Workshop on Intelligent Finance, December.
- Bernoulli. Encyclopedia of Mathematics. Springer and the European Mathematical Society. bit.ly/1OTlIh3 (accessed 20 May 2015).
Editor’s note
Many congratulations to James Skeffington on winning the 2015 Young Statisticians Writing Competition, and thank you to our partners within the RSS Young Statisticians Section for all the time and effort spent organising the contest. Articles from this year’s runners-up – Annie Herbert and Samantha Tyner – will be published at significancemagazine.com in the coming weeks, while details of the 2016 Young Statisticians Writing Competition will be announced in our February 2016 issue.


