
Despite an abundance of gingham cloth and its sweet-natured contestants, GBBO has been the cause of much drama among my circle of colleagues. This is due to our nail-biting sweepstake, and our weekly debates about who will be crowned ‘Star Baker’ of the next episode, and who will be forced to leave the competition. Our debates would be significantly less heated were there a way to use a contestant's performance in the most recent episode to predict their performance the following week. So, using data from previous series, and Bayesian statistical methods, I set out to discover whether past performance has any bearing on future performance.
The data
The show’s format is as follows: a ‘baker’s dozen’ of amateurs make three different sets of treats during each episode, according to a particular baking theme, such as cakes, bread, pastry, etc. By the end of each episode, two professional judges (in the UK, the delightful Paul Hollywood and Mary Berry) decide who has baked best during the show and thus should be crowned Star Baker (gleaning no other credit but honour), and who has baked the most poorly and should be eliminated from the competition. In the final episode of each series, three bakers are left compete to be the overall winner and take home a pretty useless yet awe-inspiring glass plaque.
Data about each of GBBO's six series are freely available via Wikipedia. These data include demographic information on the contestants (name, age, sex, region of Great Britain where they live, and job title), which I used to assign a National Statistics Socio-economic Classification, or ‘NS-SEC’, score, and this served as a proxy for socioeconomic status. Wikipedia also listed judges’ comments and scorings per episode, along with information on who was crowned Star Baker and who was eliminated in each episode.
Naïve Bayesian Classifiers
I was aware that I only had six series worth of data to play with. However, given that most series were 10 episodes long, with 12 to 13 contestants, perhaps the richness of these longitudinal data could be used to improve predictions over the course of the series.
One way of sweeping up information in longitudinal data to make predictions is through use of Naïve Bayes Classifiers (NBCs). NBCs are simply conditional probabilities which are multiplied together: for example, the probability of having a particular score from the judges during an episode given that the contestant also wins Star Baker in the following episode, multiplied by the probability of being the judges’ favourite contestant during an episode again given Star Baker status. The ‘Naïve’ part comes from the fact that probabilities are multiplied as though independent of each other, where this is unlikely to be the case – in the above example, the judges’ scorings and their decision on Star Baker are likely to be related. Despite this clear flaw, NBCs have been shown to distinguish between classes very well. The ‘Bayes’ part of the NBCs means we start with a prior probability of being Star Baker, and this is updated using these performance variables to get a posterior probability. ‘Classifiers’ are the names given to the conditional probabilities.
I attempted to use data from the first five series of GBBO, along with NBCs, to estimate classifiers of being Star Baker and being eliminated, based on performance variables during preceding episodes. Then, to test the accuracy of these classifiers, I used them to predict who would be Star Baker and who would be eliminated in each episode of Series 6.
Prior probabilities: Born winners and losers?
We could start our predictions using prior probabilities that are equal for all contestants. For example, for Series 6, we could make the prior probability of being Star Baker 1/12, per contestant. However, some contestants may already have a head start before they’ve even started baking. For example, in the first episode of the fifth series, I’m sure we all thought Diana, a die-hard member of the Women’s Institute with over 60 years’ experience of baking could outperform the others.
Table 1 shows demographic information on contestants in the first five series of GBBO – information which would have been available before their first episode – according to whether they were crowned Star Baker or not, or were eliminated or not in Episode 1. Unfortunately, as there were only ever four Star Bakers and six eliminations in a series' first episode across the first five series, the number of outcomes for either Star Baker or elimination are too small to draw any definitive conclusions. However, looking at the statistics of this very small sample, it seems that it might not hurt your chances to be female or over 40 years of age.
Table 1. Contestants’ demographic information by whether or not Star Baker or eliminated in Episode 1.
| Variable | Star Baker in Episode 1 | Eliminated from Episode 1 | ||
| Sex, n/N (%) | ||||
| Male | 1/28 | (3.6) | 3/28 | (10.7) |
| Female | 3/31 | (9.7) | 3/31 | (9.7) |
| Age in years, Median (IQR) | ||||
| Positive outcome in Episode 1 | 52 | (40, 57) | 33 | (31, 48) |
| Negative outcome in Episode 1 | 36 | (30, 43) | 37 | (30, 44) |
| NS-SEC score (1-10, 1 being high), Median (IQR) | ||||
| Positive outcome in Episode 1 | 2.0 | (1.6, 5.0) | 2.0 | (1.2, 7.0) |
| Negative outcome in Episode 1 | 3.0 | (1.2, 7.0) | 3.0 | (2.0, 6.0) |
| Region of residence, n/N (%) | ||||
| S. England | 2/31 | (6.5) | 2/31 | (6.5) |
| Wales and The Midlands | 1/14 | (7.1) | 2/14 | (14.3) |
| N. England and Scotland | 1/14 | (7.1) | 2/14 | (14.3) |
*National Statistics Socio-economic Classification score, according to contestant’s job title in Wikipedia.
Incorporating showstoppers and natural disasters
If demographic information at the beginning of a series does not give much indication of how contestants will perform, it is reasonable to assume that performance data from later episodes will. Figure 1 shows how we could update predictions from episode to episode using performance variables. We would take the initial prior probability of being Star Baker in Episode 1 for a particular individual, using their information just before Episode 1 (set to being either equal probability between all contestants, or tweaked according to demographic information, e.g., using proportions such as those displayed in Table 1). We then multiply this prior probability by further conditional probabilities (the Naïve Bayesian Classifiers) based on other pieces of information for that individual during Episode 1, such as whether or not they were one of the judges’ favourites. This final multiplied probability is then considered to be the probability of being Star Baker in Episode 2, and the individual with the highest of these probabilities is our predicted Star Baker. These running probabilities can be updated per individual, at Episode 2 to arrive at a probability of winning Star Baker in Episode 3, then at Episode 3 to arrive at the probability of winning Star Baker in Episode 4, and so on. Predicting who will be eliminated in the next episode can be estimated in much the same way.

Figure 1. How probability of winning Star Baker is estimated and updated per episode.
I developed classifiers using:
- the judges’ ranking between contests for their ‘technical bake’ (one of three set challenages in each episode);
- the judges’ explicitly-stated favourite contestants;
- the judges’ least favourite contestants; and
- the judges’ chosen Star Baker at the end of the episode.
In the case of the technical bake ranking, as the number of contestants decreases with each episode, I standardised the ranking between episodes as a rank score = 1-(ranking/number of contestants). Thus, for updating our running probability per individual, I needed to estimate classifiers for one numerical (continuous) and three binary variables.
To estimate classifier values for categorical variables, such as being one of the judges’ favourite contestants, I took all the participants from previous series who had been Star Baker in Episode 2 or later, and calculated what proportion were judges’ favourites in the preceding episode (Figure 2). For example, in Series 1-5, of 51 crownings of Star Baker in Episode 2 and onwards, ten had also been one of the judges’ favourites in the preceding episode. Therefore the classifier for being the judges’ favourites was estimated as 10/51 = 0.20. I also estimated a classifier for not being one of the judges’ favourites and being Star Baker in a following episode (41/51 = 0.80). Therefore each contestant’s running probability was updated, per episode, according to whether they were one of the judges’ favourites or not. These methods were repeated in the same way for estimating classifiers for the variables of being one of the judges’ least favourite contestants, or being Star Baker in a preceding episode.
To estimate a classifier value for a numerical variable such as rank score, I used similar methods as for estimating classifier values for categorical variables. I needed to estimate the conditional probability of having the exact rank score of a particular contestant, given the distribution of rank scores for contestants who did win Star Baker in the following episode (Figure 2). This could be estimated by taking the rank score, e.g., for ranking secondin Episode 1, so 1-(2/12) = 0.17 if the series in question had 12 contestants, and estimating the probability of such a score. This probability could be estimated on the condition of Star Baker status by assuming a Normal distribution with the mean and standard deviation of all rank scores for contestants who were also Star Baker in a following episode. For Series 1-5 data, this was P(rank score = 0.85 | won Star Baker in a following episode) = 0.45, which was estimated from the Normal distribution of mean 0.46, standard deviation 0.24. Again, a different classifier value was estimated for every possible rank score.
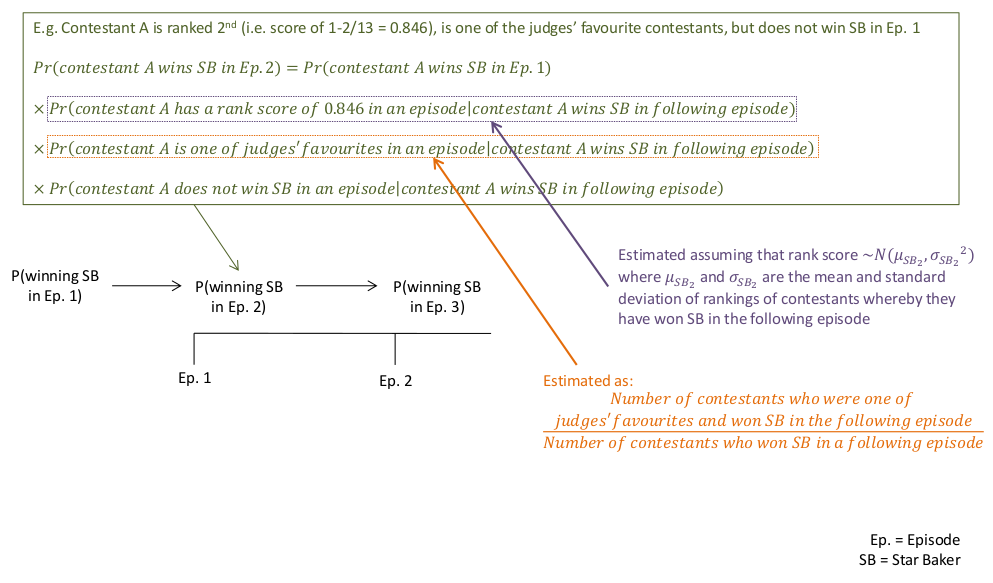
Figure 2. Calculating the values of classifiers.
Testing my predictions
So what were the classifiers, and how good were they? Figure 3 shows the values of the classifiers using Series 1-5 data. As you can see, whatever the outcome in the next episode, you’re at a higher probability of not being one of the judges’ favourites, least favourites, or Star Baker, than receiving any of these statuses, which is to be expected. The point estimates of classifiers for favourite, least favourite, and not having these statuses, appear to weakly distinguish between the extremes of being nominated as Star Baker or being eliminated in the following episode, but these relationships are unlikely to be strong enough to make accurate predictions. Among the three categorical variables, Star Baker status – interestingly enough – appears to be the weakest in determining a contestant’s fate the following week.
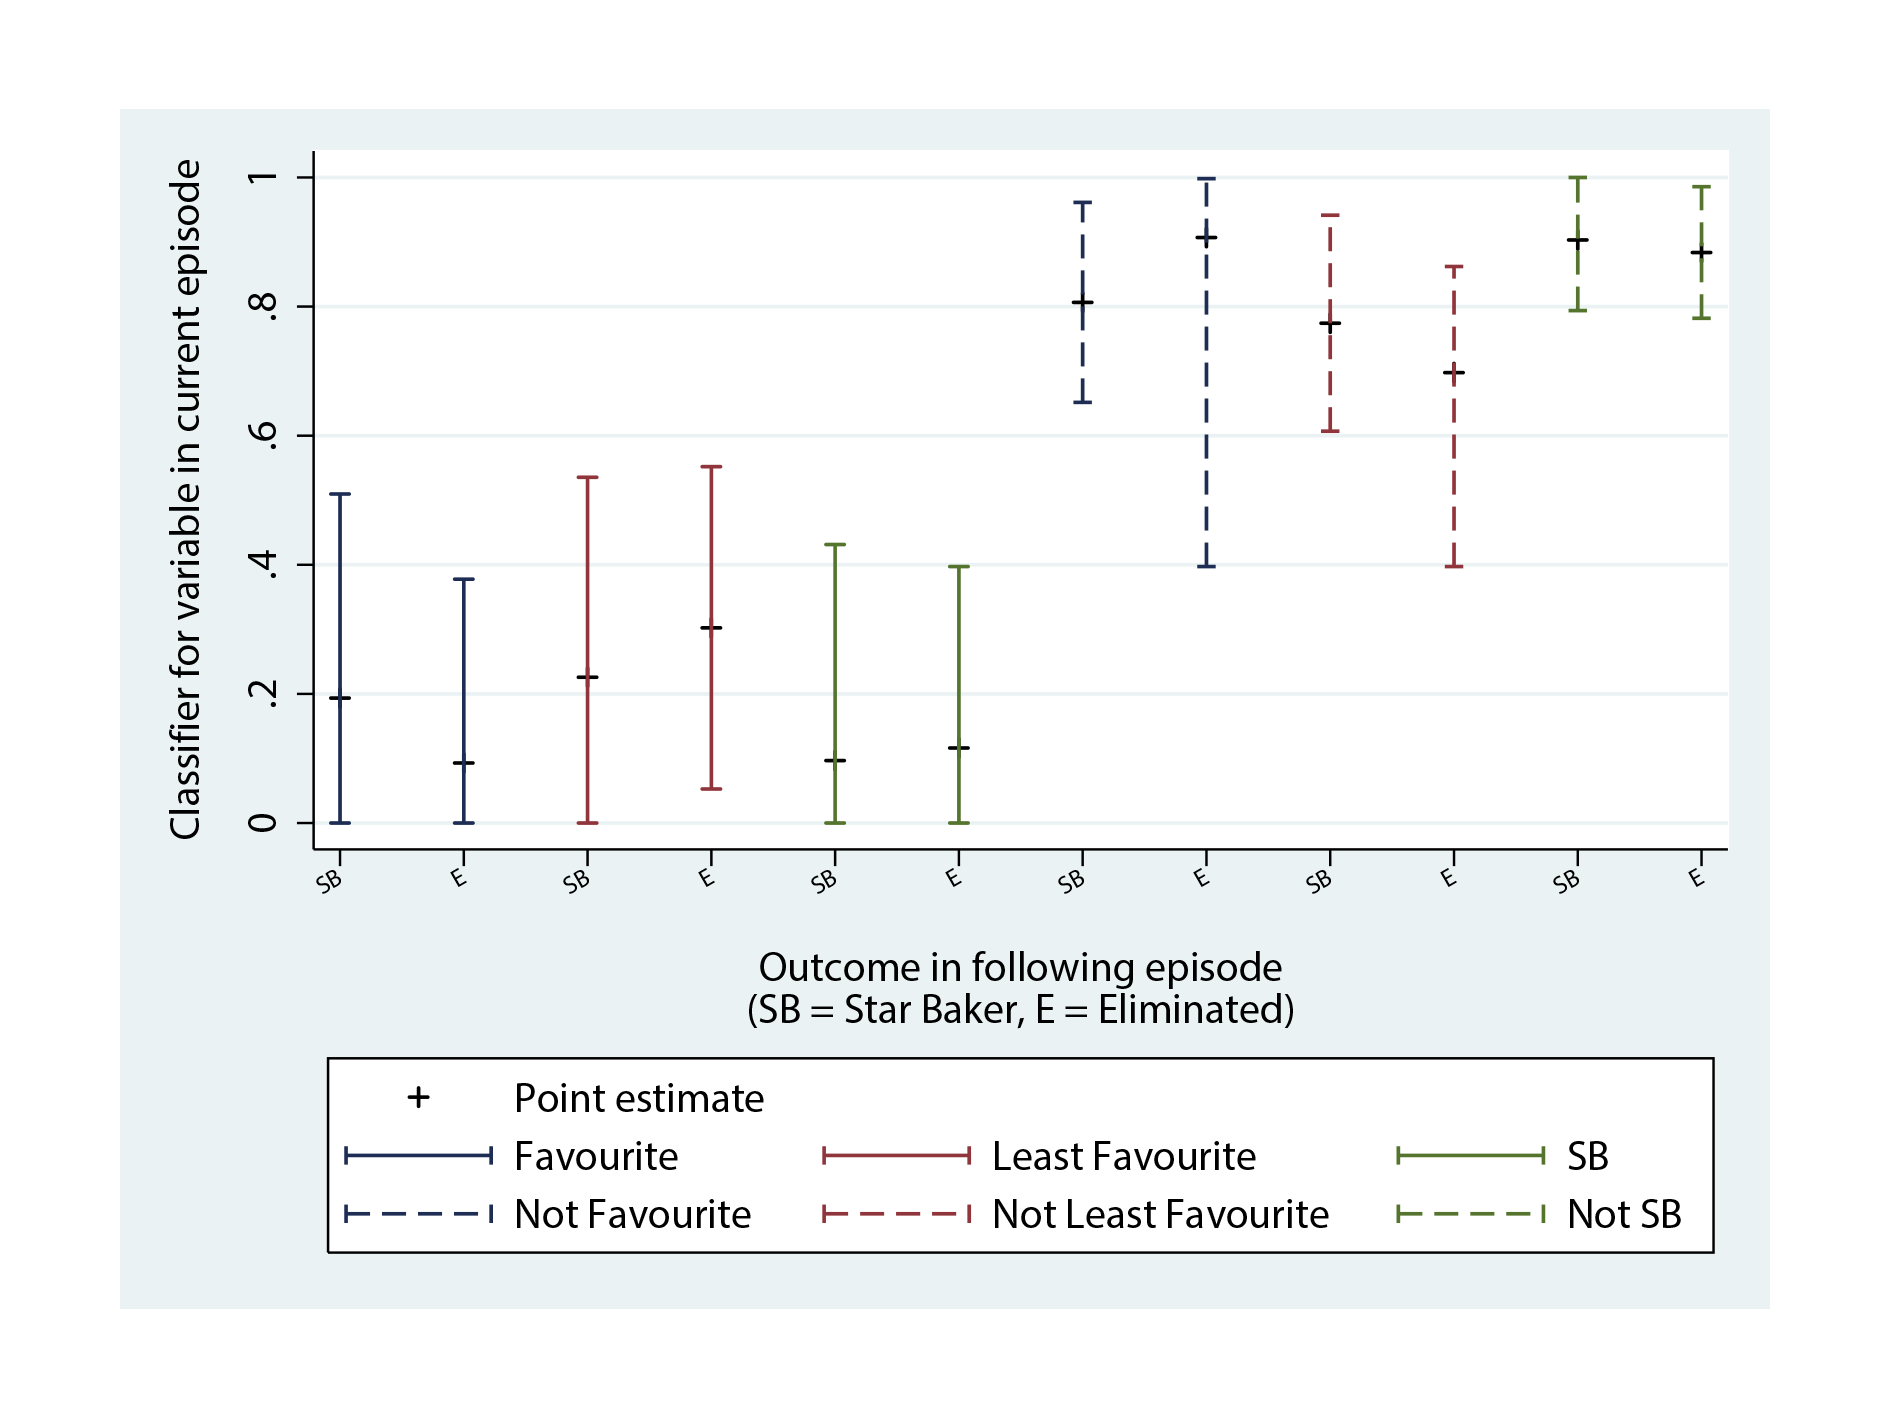
Figure 3. Classifier values for performance variables, for the outcome of Star Baker and Elimination in the next episode.
Figure 4 shows that technical scores don’t provide much insight about what will happen in the next episode either. Other than a small shift towards lower technical scores in those that aren’t nominated as Star Baker for the following episode, the other probability curves almost entirely overlap.
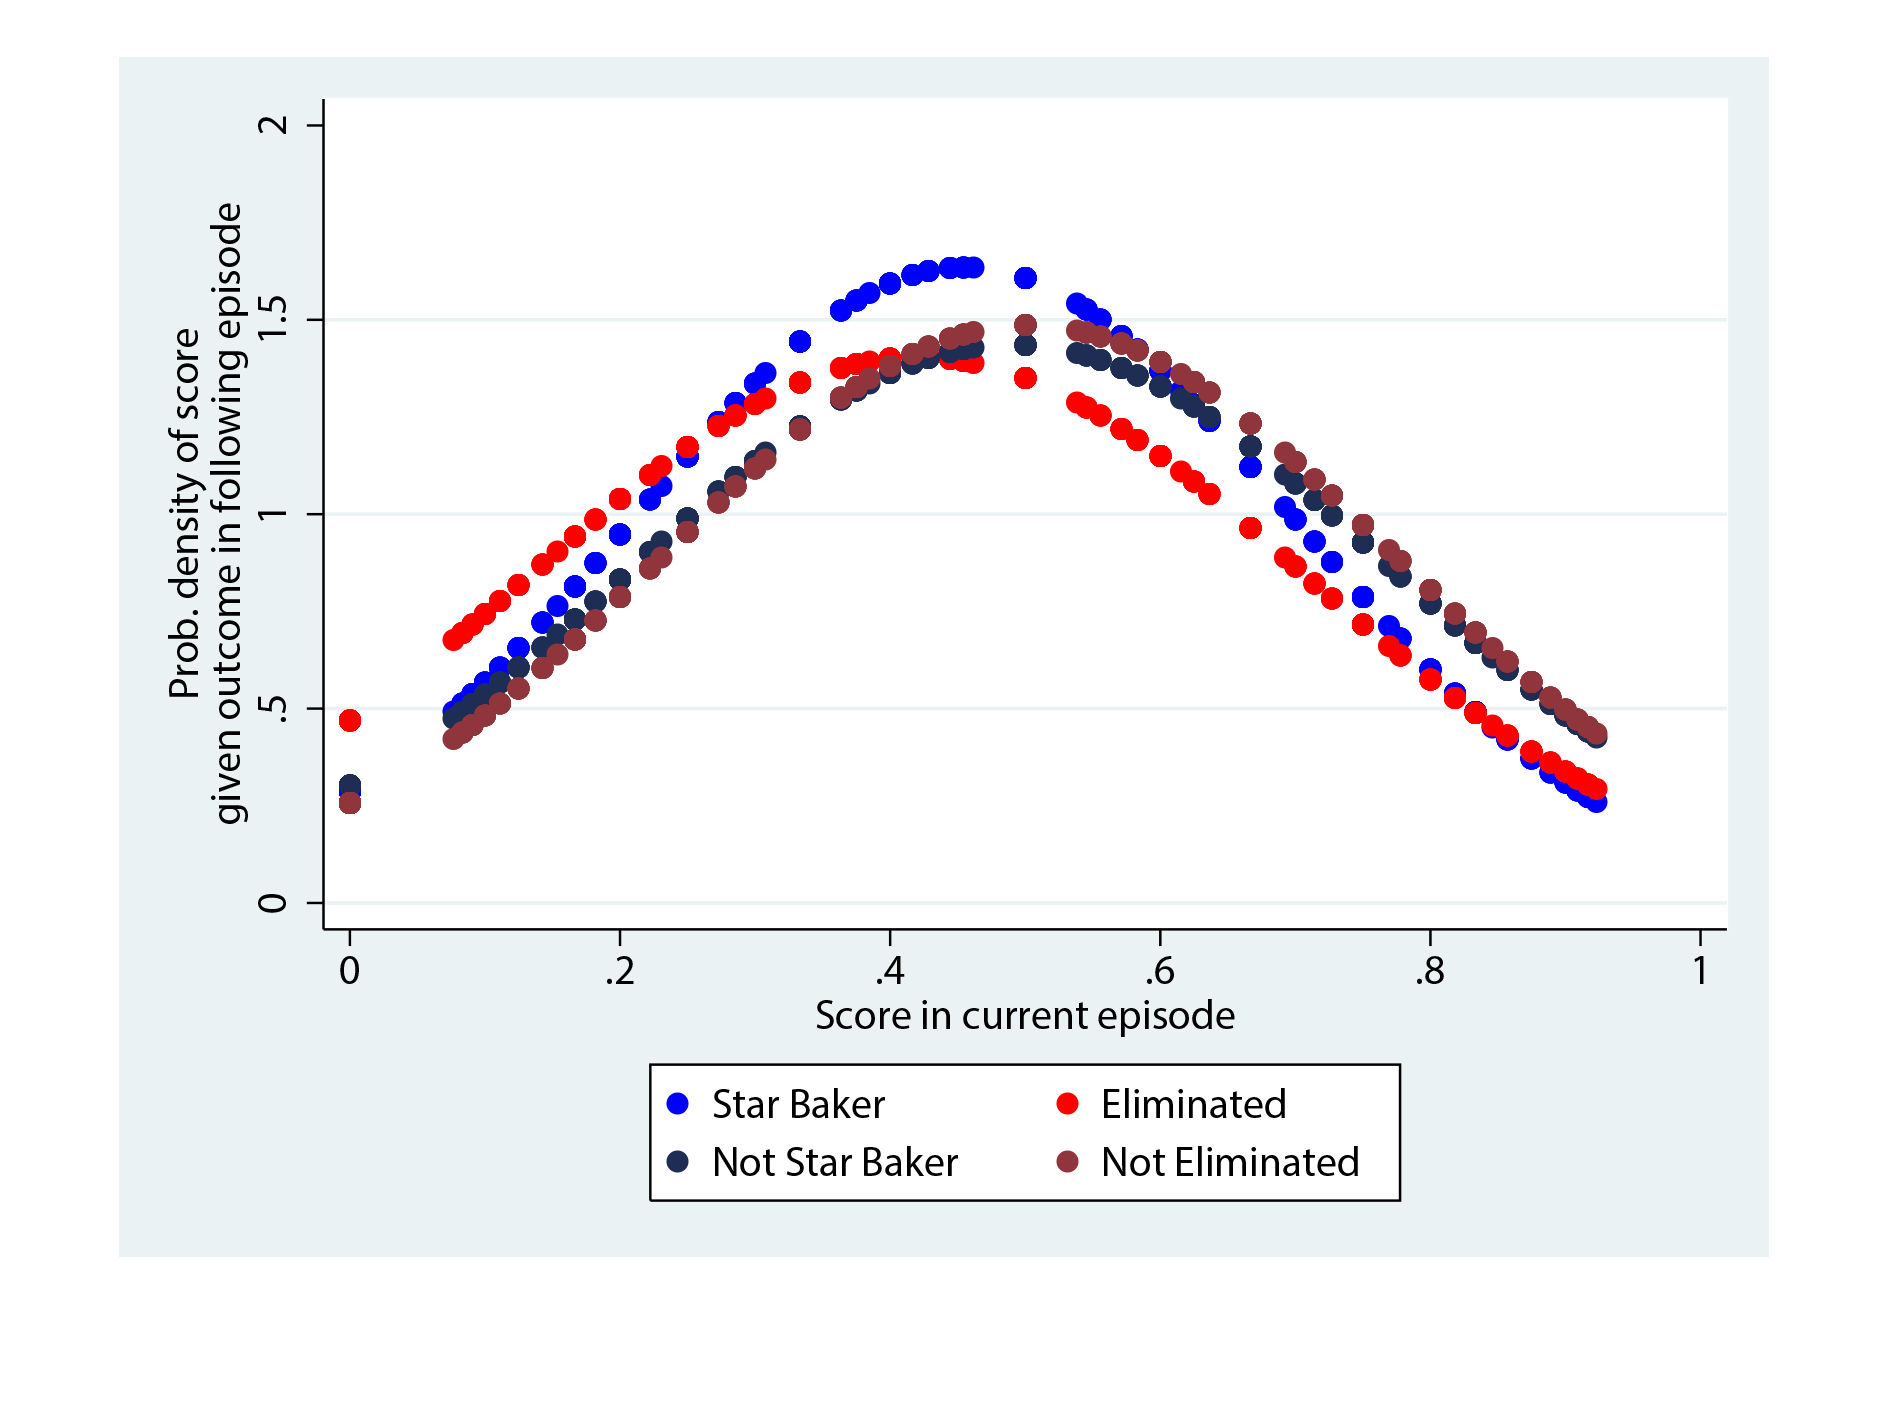
Figure 4. Probability density functions of technical ranking scores, for those who are Star Baker and not, and those eliminated and not.
I applied the same classifiers estimated from Series 1-5 to Series 6 data, and given the poor discrimination of the individual classifiers, I wasn’t too surprised that the predictions that resulted were almost as good as guessing. These classifiers in combination only accurately predicted one of the Star Bakers and two of the eliminated contestants across Episodes 2-9.
So, how much difference does a soggy bottom (or poor performance during one episode) make? Not a lot, or so it would appear. Either that, or five series’ worth of data just isn’t enough to make good predictions about what will happen. In a previous Significance article, which sought to predicting the winners and losers of another popular reality TV show, The Apprentice, the authors found that while age and highest educational qualification were mildly significant predictors of success and failure over 10 series’ worth of data, they struggled to find relationships between any other variables.
Given more series’ worth of data, perhaps I could find further evidence for the mild associations between sex, age and success in GBBO's first episodes, or perhaps we would see stronger predictive power of the classifiers than in the six series so far. Either way, when the office sweepstake comes around next year, I plan to pick a older female contestant, who looks like she might do well in a technical bake.
Editor's note
Annie Herbert was a finalist in the 2015 Young Statisticians Writing Competition, organised by Significance and the Young Statisticians Section of the Royal Statistical Society. James Skeffington's winning article is online here. Details of the 2016 Young Statisticians Writing Competition will be announced in February.


