
In a crisis, do you gamble on fast but imperfect data – or wait for accuracy that might come too late? When the clock is ticking, how do statisticians balance speed with the reliability decision-makers depend on? What happens behind the scenes when statisticians are asked to deliver in days insights that once took months? A Royal Statistical Society initiative seeks to help statisticians forced to make compromises
Data is key to informing decision-making. However, in our rapidly-changing world, data is rarely perfect, and decisions must often be made at pace.
When working under pressure, it can be challenging for statisticians and analysts to judge when data or other statistical outputs are good enough to inform decisions, and which trade-offs can appropriately be made. These considerations are crucial to ensure that data and statistics that are good enough can be used with confidence, and decisions are not otherwise made in the absence of data.
The Royal Statistical Society’s (RSS) Statistics Under Pressure initiative sprang from the Covid-19 pandemic, where the importance of data being used to inform decision-making was brought into sharp focus. But this issue is by no means limited to pandemics or emergencies: by talking to statisticians and analysts from across government, industry and academia, we found that balancing trade-offs was a key part of every statistician’s role.
We began this initiative in order to foster an environment in which statistics, data and modelling that are good enough to inform time-pressured decisions can be used with confidence. We wanted to support statisticians to provide the best possible statistics under pressure, including consideration of when and how to make suitable trade-offs. We also wanted to raise awareness around the need for trade-offs in real-world circumstances, along with the merits of such an approach.
Bringing trade-offs to life
As the first stage of this initiative, we developed a series of case studies to illustrate instances and share behind-the-scenes insights from situations in which compromises had to be made to allow data to best inform decision-making. We highlight the trade-offs that had to be balanced, and why these compromises were necessary.
Our nine case studies cover a wide range of prominent statistical and data projects, with examples from the Covid-19 pandemic – and before – to more recent examples, including in health, economics, and public statistics.
Take a look at the Statistics Under Pressure case studies to find out how the Covid-19 dashboard team determined which data to include on the dashboard and how to present it – under intense public scrutiny – or how the Covid-19 Infection Survey team worked under pressure to provide timely results that were robust enough to inform decisions, including balancing trade-offs relating to survey set-up, representativeness and communication of results.
Maybe you are interested in hearing more about furlough (Coronavirus Job Retention Scheme) statistics and how public interest in the new scheme required fast-paced publication of information on businesses and employees being supported, through setting up novel data feeds and processing pipelines from scratch. Or maybe you would like to delve into the world of transport statistics, exploring how these were used during the pandemic as a proxy for adherence to policies such as social distancing, and how the team had to develop new methods to provide car, bus and active travel data real-time, including considering trade-offs relating to data coverage, granularity, quality assurance and publication.
Our case study on the 2018 Salisbury poisonings unpacks how statisticians worked under pressure to ensure that the public were safe from harm and to allow public life to return to normal as soon as possible, after a nerve agent was used to poison a former Russian military officer and his daughter on UK soil, including balancing a range of factors to determine suitable levels of coverage and confidence for sampling plans. Our case study on badger culling and cattle health, meanwhile, takes a closer look at how much data is enough to inform decision-making, including balancing statistical evidence with policy, economic, ecological and ethical considerations when interim results indicated a detrimental impact of a certain type of badger culling on cattle health and a decision had to be taken on whether to stop the trial early or to continue collecting data.
Or perhaps you are interested in exploring the trade-offs involved in harmonising homelessness data across the UK, including weighing up factors including value and impact with resource and time, as well as considering the feasibility and suitability of harmonisation, to be able to assess and compare levels of homelessness and enable joined-up policy-making across the devolved nations. You might also be curious to dig into what happens when statistical estimates are volatile and change significantly after revisions, taking the example of quarterly regional Gross Domestic Product (GDP), where the statistical team had to consider whether the estimates were fit for purpose and good enough to inform decision-making, or whether their publication should be paused until methodology was improved, weighing up factors including demand for the figures, quality concerns, the impact of revisions, and capacity considerations.
Finally, in our case study on the Infected Blood Inquiry, we consider the trade-offs that had to be balanced to estimate infections and deaths due to treatment with blood contaminated with HIV, hepatitis C and hepatitis B, under intense public scrutiny in an area of heightened sensitivity, including weighing up the need for answers with challenging data limitations.
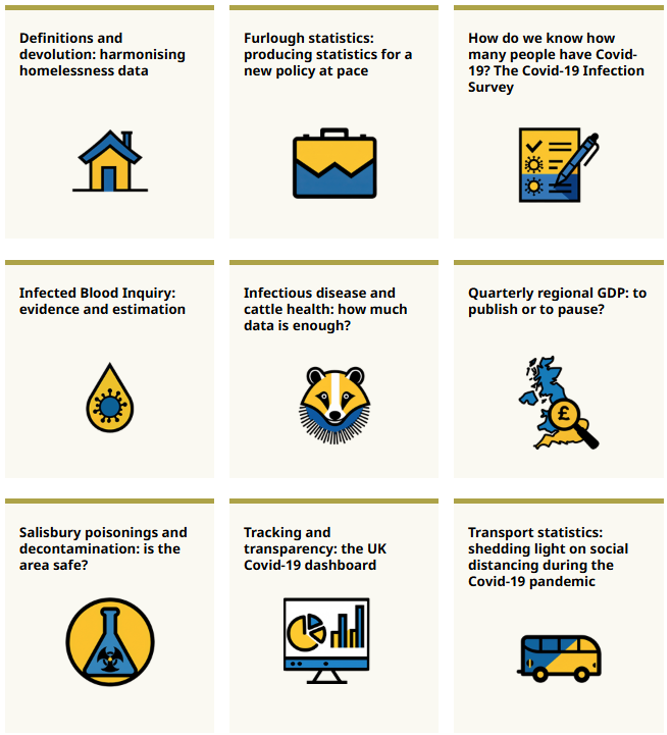
Figure 1: Take a look at the range of Statistics Under Pressure case studies – on topics spanning Covid-19 and health to economics to the Salisbury poisonings.
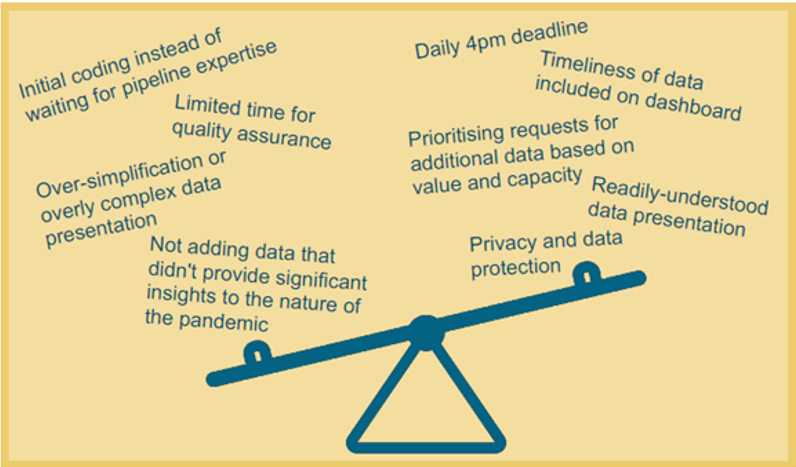
Figure 2: Infographic illustrating factors that had to be balanced in the Covid-19 dashboard case study.
Principles to support appropriate trade-offs
By looking across the case studies and through discussions with a range of stakeholders, we developed a set of principles to help statisticians and analysts consider when and how to appropriately make trade-offs, in line with good practice.
We set out five principles – each related to the others – that should be considered when balancing competing demands to enable evidence-informed decision-making. Alongside each principle we include a selection of questions for statisticians to consider.
- Understand purpose and stakeholder needs – who needs this and what for? Is the output proportionate to need, and is the work/effort put in proportionate to the need?
- Prioritise with justification – what is the core “minimum viable product”? What is “necessary” versus “nice to have”, and what is the best way to spend time and resource to maximise the utility to the output?
- Manage and mitigate risk – have you considered short- and long-term risks and how to mitigate them? Have you documented your justifications behind each of your decisions?
- Communicate transparently and accessibly – have you explained the trade-offs and limitations, in a way that is appropriate to your stakeholders’ needs? Have you considered appropriate wording and wording to be avoided?
- Monitor and adapt – are you monitoring the quality of the output and its reception, including understanding factors influencing this? Are you considering refining and improving as context and demands change, and communicating the reasons for any changes? Are you considering the impact of adapting outputs (e.g. on continuity/comparability)?
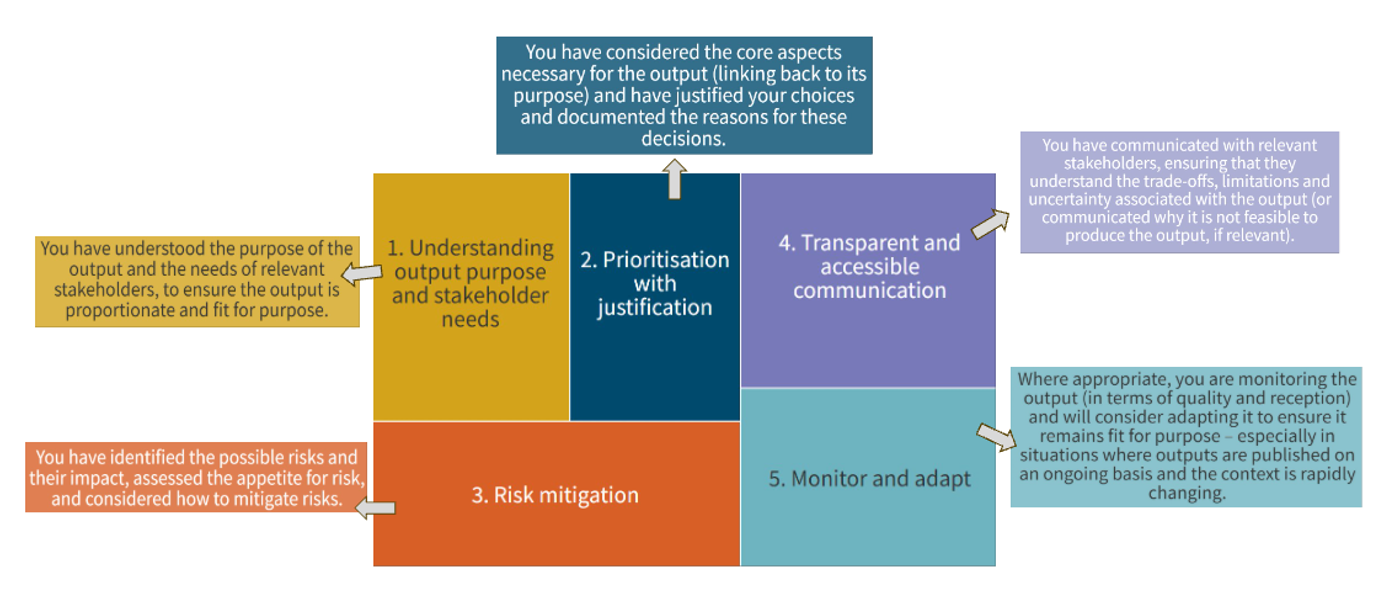
Figure 3: Five principles for statisticians when compromises are unavoidable.
We hope the principles are useful to statisticians and analysts for both previous and future work. They can be referred back to when reflecting on past instances in which compromises had to be made, in order to support the decisions made or consider alternative steps that could have been taken. They can serve as a useful checklist of factors to consider in future work. We also hope these principles can be helpful in instances when certain trade-offs may not be suitable and statisticians have to say ‘no’ – to help them reach this conclusion and explain why.
The principles build on and link to existing work in this space. The RSS has long called for an increased focus on user engagement and transparent communication when producing statistics, in line with its call for public statistics. This is needed to meet the vision in the Office for Statistics Regulation’s Code of Practice for Statistics of trustworthiness, quality and value.
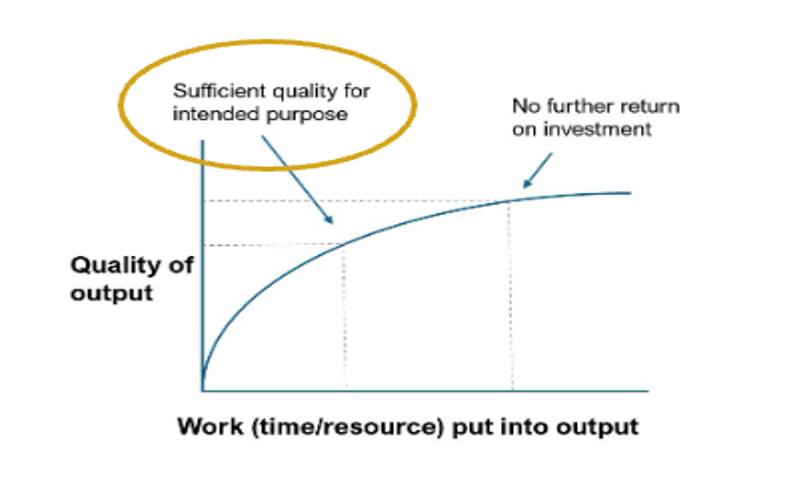
Figure 4: Image illustrating an example relationship between work (time/resource) and output quality. The first dotted line indicates sufficient quality for intended purpose, which depends on the work invested. The second dotted line indicates that there will be a point at which further work makes no appreciable improvement to quality.
We have also developed policy recommendations to help ensure that government is set up to allow data and statistics to efficiently and effectively inform decision-making in fast-paced situations. These touch on areas including: considering data from the outset of policy-making; data literacy training for policy-makers; use of confidence ratings on statistical outputs; considering team structure to enable evidence-informed decision-making; and considering long-term value in funding decisions, including investing in infrastructure and technology that will allow for preparedness in future pressurised situations.
Your views
We welcome your thoughts on this project, including feedback on what you would find helpful to support you to produce, communicate, use, or interpret statistics and data in high-pressure fast-paced circumstances. Let us know your thoughts at policy@rss.org.uk.
Article by Deniz Gursul, RSS campaigns and policy manager, and the Statistics Under Pressure steering group:
- John Aston (chair) – RSS President, Harding Professor of Statistics in Public Life and pro-vice-chancellor for research at the University of Cambridge
- Paul Allin – RSS Honorary Officer for Public Statistics, visiting professor in the Department of Mathematics, Imperial College London
- Christl Donnelly – Past RSS Vice President for External Affairs, professor of applied statistics at University of Oxford and visiting professor at Imperial College London
- Clare Griffiths – previously head of the UK COVID-19 dashboard, currently head of public health analytical product development at the Department for Health and Social Care
- Sarah Walker – chief investigator of the Covid Infection Survey, professor of medical statistics and epidemiology at the University of Oxford.


