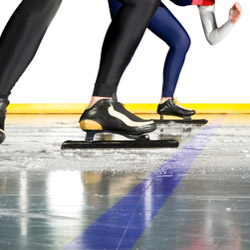
Most would think that ice is rather uniform. A different view emerges by standing on a frozen lake. The ice emits other-worldly sounds as changes in temperature cause it to heave and crack. There are smooth dark areas that provide good skating, interrupted by white areas of cracked ice that are so irregular that it’s easy to trip. That was the world-view of early Olympic speed skating, held outdoors from the first competition in 1924 (for men only at that time) until 1956. In 1924, men competed at 500m, 1500m, 5000m and 10000m. The 1000m race was added in 1976. Women first competed in 1960 (by which time competition had moved indoors) at 500m, 1000m, 1500m and 3000m. The 5000m race was added in 1988.
| Olympic Year |
% I/O (Men) |
% I/O (Women) |
VW/VM (%) |
| 1924 | N/A | ||
| 1928 | -1.00 | ||
| 1936 | 3.41 | ||
| 1948 | -0.08 | ||
| 1952 | 1.32 | ||
|
1956 (Cortina, last outdoors) |
5.20 | ||
| 1960 | 0.75 | N/A | 89 |
| 1964 | 0.67 | 1.13 | 90 |
| 1968 | 2.77 | 1.07 | 87 |
| 1972 | 1.16 | 2.44 | 89 |
| 1976 | 1.15 | 2.24 | 90 |
| 1980 (Lake Placid) | 3.79 | 4.22 | 90 |
| 1984 | -1.50 | 3.01 | 94 |
| 1988 (Calgary) | 5.16 | 4.44 | 93 |
| 1992 | -2.70 | -4.02 | 92 |
| 1994 (Lillehammer) | 3.86 | 2.84 | 92 |
|
1998 (First clap skate use) |
2.49 | 3.27 | 92 |
| 2002 (Salt Lake City) | 3.14 | 3.17 | 92 |
| 2006 | -1.16 | -2.30 | 91 |
| 2010 | 0.13 | 0.09 | 91 |
| 2014 (Sochi) | 0.98 | 1.76 | 92 |
| 1928-1956 | 1.77 | ||
| 1960-1994 | 1.53 | 1.80 | 91 |
| 1998-2012 | 1.12 | 1.20 | 91 |
|
%I/O = Percent improvement per Olympiad. |
|||
The three ages of Olympic speed skating history
The table on the right summarizes the percent improvement per Olympiad (%I/O) of male and female Olympic champions. The three periods include outdoor competition (1924-1956), indoor competition before the introduction of clap skates (1960-1994) and competition from the introduction of clap skates in 1998 until the present. The clap skate permits the use of powerful extensor muscles due to the hinged skate which retains contact with the ice as the leg is extended.
At Cortina, Italy in 1956, the 5.20% %I/O for men represented an increase of 471% from the average of 0.91% for 1924 to 1952. All ice is not created equal. The site at Lake Misurina was located 1750m above sea level, an area that was dry and wind shielded, but he ice technicians wanted more. An ice-free oval channel was cut about one foot in width completely surrounding what would become the skating rink, preventing heaving and cracking.
The Russians re-entered Olympic post-war competition that year. When some skaters’ practice times exceeded their best previous times, they measured the rink (not wanting to lose any eventual world records). The length was correct and moreover, their measuring device recorded unprecedented smoothness. That was to be the best ice anyone had ever skated on, thanks to those tireless ice technicians.
The indoor ice at Calgary in 1968 was also exceptional. At 1080m above sea level, the area was dry, like Cortina. The temperature and humidity in the ice rink was carefully controlled. The %I/O for men was 5.16%, only marginally less than at Cortina. Women experienced their greatest one-time average improvement of 4.44%. Cortina and Calgary can share the best-ice gold medal.
Improvements in 1980 and 1994 were only partially due to good ice. In 1980, East Germany and Russia challenged each other and Eric Heiden (USA) broke records. In 1994, the Games were held in Scandinavia, a hot bed for the sport. Johann Olav Koss (Norway, men) and Bonnie Blair (USA, women) provided improvements in the 1990s.
The 1998 Games saw the re-introduction of the clap skate, which had had a brief life in the 1890s. That introduction brought improvements of 2.49% for men and 3.27% for women in 1998, even though there had been a large improvement four years earlier. Usually, a large improvement is followed by a small one. The clap skate had proven its worth.
A third consecutive large %I/O followed at Salt Lake City in 2002 (3.14% for men and 3.17% for women). The rink was located 1280m above sea level and again conditions were dry. Technicians created an outstanding climate control system. Salt Lake was a tough act to follow: performances were worse in 2006 and about the same in 2010 as in 2006.
That brings us to Sochi. Again, technicians created an impressive climate-controlled system. The result was the first real improvement since Salt Lake (men improved 0.98% over 2010 while women improved 1.76%). Still, only 4 out of 10 winning times were better than at Salt Lake. So the all-time good-ice medals go to Cortina, Calgary and Salt Lake City.
As to gender equity, women improved more than men during the second period (while catching up in terms of training and coaching) until women skated 91% as fast as men, just as they do today. Women are also 91% as lean as men, that is, relative velocity is now driven only by physiological difference.
The torch has now passed. The ice technicians at Pyeongchang have their work cut out for them. The speed-skating youth of the world are challenged to gather in Korea in 2018 and finally improve upon the times set in Salt Lake City.


