My previous Significance article outlined statistical-based forecasts for the 2019 Rugby World Cup (RWC) by Rugby Vision. According to these forecasts, New Zealand were favourites to win the tournament, but the All Blacks were convincingly beaten by England in a semifinal, and South Africa were crowned 2019 RWC champions.
Does this mean that the algorithm should be ‘kicked into touch’? The short answer is ‘no’. In the same vein, the algorithm’s forecast that New Zealand were favourites when they won the 2015 RWC does not mean that it is a crystal ball. The algorithm’s RWC performance is dissected below.
Which teams were most likely to win the RWC?
According to the algorithm’s pre-tournament forecasts, the teams most likely to win the 2019 RWC were New Zealand (who had a 57.7% chance of winning), England (14.4%), South Africa (12.8%), Ireland (5.6%), and Wales (5.2%). After the pool stage of the competition – when New Zealand, England and Ireland qualified on the same side of the knockout draw – the most likely winners were New Zealand (48.7%), South Africa (23.1%), England (17.2%), Wales (4.5%) and Ireland (3.5%).
Some pundits may say that South Africa’s RWC triumph means that the algorithm was wrong, but such a conclusion is too simplistic when evaluating probabilistic forecasts. By evaluating a single outcome, it is possible to choose an observation to claim that the algorithm was terrible (New Zealand did not win the RWC) or fantastic (the most likely semifinalists according to the algorithm – England, New Zealand, South Africa and Wales – all qualified for that stage of the competition).
Game-by-game predictions
A more robust evaluation method examines the algorithm’s predictions for each RWC game. For each game, the algorithm predicted the probability of each team winning and the expected winning margin of the favourite. For example, in a quarterfinal, the algorithm estimated that Wales had a 67.3% chance of defeating France, and their expected winning margin was six points. This means that if (hypothetically) the quarterfinal was played 100 times, Wales would be the favourite in each game, but France would be expected to win 33 games (and Wales would be expected to win 67 games). In other words, the algorithm expects upsets to happen but it doesn’t know when they will occur.
Figure 1 displays the expected winning margin (horizontal axis) and observed winning margin (vertical axis) for the algorithm’s favourite in each game. Games with positive observed winning margins indicate that the algorithm’s favourite won, and games with negative winning margins represent an underdog victory. For example, in the opening game (jpn_rus, green marker in Figure 1), Japan were expected to beat Russia by 30 points and they won by 20 points; and in the first semifinal (nzl_eng, black marker in Figure 1), New Zealand were expected to defeat England by eight points but they lost by 12 points.
Overall, the algorithm’s favourite won 40 out of the 45 (88.9%) games played (three games were cancelled due to Typhoon Hagibis). The trend line indicates that, on average, larger observed winning margins are associated with larger predicted winning margins, and there is essentially a one-to-one relationship between observed and predicted margins. (Specifically, the slope coefficient for the trend line is 0.991, and the R-squared for the trend line regression is 0.798.) This shows that predicted margins were unbiased estimates of actual margins.
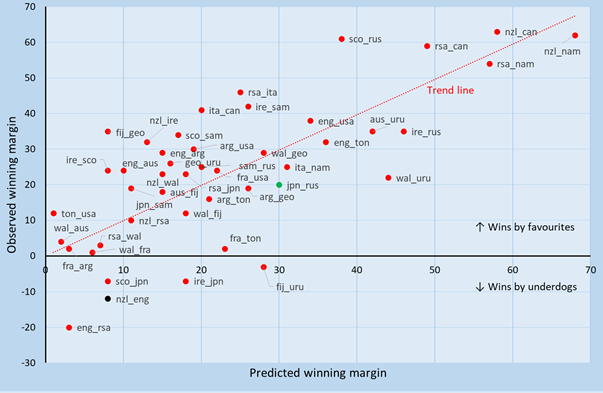
FIGURE 1 Predicted winning margins (horizontal axis) and observed winning margins (vertical axis) for the pre-game favourite (listed first) for each game.
Did upsets occur at the same rate as expected by the algorithm? For the 2019 RWC, the algorithm expected its favourites to win 38 games. Favorites ended up winning 40 games, so there were two more wins by favourites than expected. In the 2015 tournament, favourites were expected to win 42 games and they won 41, so there was one fewer win by favourites than expected. Aggregating 2015 and 2019 RWC results, favourites were expected to win 80 of the 93 games and they won 81. These results suggest that, on average, the algorithm’s estimated probability of an upset in each game is accurate.
The algorithm’s performance can also be evaluated by comparing its performance relative to other predictors. In the 2019 RWC, the algorithm finished in the top 9% of the more than 300,000 participants in Superbru’s RWC prediction league, which awarded points based on prediction accuracy in each game. In the 2015 RWC, the algorithm finished in the top 13% of participants.
Algorithm vs. betting markets
To further compare the algorithm’s performance to other predictors, Table 1 reports summary statistics for the algorithm and bookmakers for the 2015 and 2019 RWCs. In both years, the number of wins by the algorithm’s favourites equaled the number of wins by bookmakers’ favorites. The stalemate is broken by comparing average prediction errors. For the algorithm, the prediction error for each game is calculated as the difference between the observed winning margin and the expected winning margin. For bookmakers, the prediction error is the difference between the observed margin and the bookmakers’ handicap for the favourite. (The handicap for a game is the number of points taken away from the favourite’s final score to make a game an even contest, and corresponds to the bookmakers’ expected winning margin.) The algorithm’s predictions in 2019 were, on average, 0.6 points closer to the observed winning margin than bookmakers’ forecasts. In the 2015 tournament, the algorithm’s prediction was, on average, 1.3 points closer to observed results than the bookmakers’ handicap. These results indicate that the algorithm’s predictions were, on average, more accurate than the bookmakers’ handicaps.
TABLE 1 Prediction summary for the algorithm and bookmakers at the 2015 and 2019 RWCs.
| 2015 RWC | 2019 RWC | |||
| Algorithm | Bookmakers | Algorithm | Bookmakers | |
| Wins by favourites | 41/48 (85.4%) | 41/48 (85.4%) | 40/45 (88.9%) | 40/45 (88.9%) |
| Average prediction error | 11.5 | 12.8 | 11.2 | 11.8 |
| Spread/handicap bets won | 28/48 (58.3%) | – | 26/45 (57.8%) | – |
| Profit from a $100 spread bet on each game | $548 | – | $466 | – |
Table 1 also reports the number of spread/handicap bets won by the algorithm. The bookmakers’ handicap for each game is intended to result in a wager on either team having a 50% chance of succeeding, so the 58.3% and 57.8% spread success rates in, respectively, 2015 and 2019 are further evidence that the algorithm’s predictions outperformed bookmakers’ handicaps. Accounting for the bookmakers’ profit margin, a $100 spread bet on each game according to the algorithm’s predictions would have resulted in a profit of $548 in 2015 and $466 in 2019.
The final whistle
The algorithm’s RWC predictions were unbiased estimates of actual outcomes, and upsets occurred at about the rate expected by the model. The algorithm’s 2015 and 2019 RWC predictions outperformed bookmakers’ handicaps, even though the predictions were publically available before bookmakers released their handicaps. The algorithm’s predictions provide a reliable forecast of likely RWC outcomes, but unlikely results should be expected to occur from time to time.
About the author
Niven Winchester is a principal research scientist at the Massachusetts Institute of Technology, a senior fellow at Motu Economic & Policy Research, and a principal at Vivid Economics.
Additional information
Archived predictions for the RWC and other rugby competitions are available at rugbyvision.com.
Editor’s note
This article was updated on 22 November 2019 to correct the information in two cells of Table 1: spread/handicap bets won, and profit from a $100 spread bet on each game, both for 2019 RWC.


