

Non-parametric analysis can help assimilate raw government data into insights that make sense of how the economy is changing. Take the data for this March, that details the nation’s twelve major metropolitan areas and the amount of jobs that were created in different sectors. This data is typically release-delayed versus the national aggregate tables.
It is true that these cities generally grew less quickly than the rest of the US, and hence they only accounted for about 30% of the national job growth. But to analyze city-level idiosyncrasies we can explore just this segment of jobs and see what patterns emerge. For example, there were recently 41.9 million workers between these 12 metro areas (up 614,000 from a year prior)
Using the non-parametric statistical model of Chi-square (χ^2) against this raw data, we can tease out the significance of these changes over a one-year period (looking again at the 120 city/industry combinations sum to the net of 614,000 jobs gain). While the test shows not to be very significant, it does provide the groundwork to reasonably sort the data and check for other characteristics.
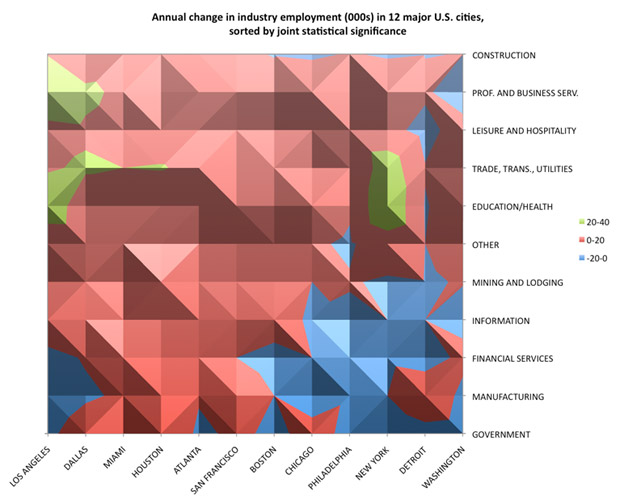
What this reveals is that there were annual job losses of several thousand government workers (colored blue) in each of a few east coast cities, amounting to an outright recession for those people and others in the lower-right cavity of the chart.
Similarly we notice that the left-hand side of the chart represents the faster growing half-dozen of the twelve cities. They are all the more southern and sunnier locations. The three farthest to the right, New York, Detroit, and Washington, were the ones at the apex of the financial crisis and bailout.
Also, what does it tell us about the ‘frozenomics’ excuse for job recovery and slow growth in the early winter of 2014? Well construction jobs were amongst the fastest growing jobs in the past year in most parts of the country.
Sure the data is all there in the raw format presented at the top of this article. It’s just that without statistical analysis of the economic data it is nearly impossible to make sense of the maze of cross-sectional data. And in particular, notice these patterns.


