
From a peak of over 96% of the national vote in 1951, the total vote share for the Conservatives and Labour combined has declined to 65% in 2010. While the first-past-the-post system has limited the number of seats secured by other parties, it did not prevent the Liberal Democrats from achieving sufficient seats to be pivotal in a hung parliament after the 2010 election, and the structure of Conservative and Labour competition is shaped by the different third and fourth parties they compete with in different constituencies.
So more than ever, understanding what is happening to support for the Liberal Democrats, SNP, Plaid Cymru, Greens and UKIP is important to understanding the outcome of the 2015 election, even if these parties still win relatively few seats.
Last summer, we developed a new model for summarising what we can expect to happen in the upcoming election, given what we know from history, geography, demography and polling data. This involves providing predictions about vote share in every seat and also providing uncertainty estimates that characterise what ranges of outcomes are most likely. Characterising uncertainty is important because it allows us to put probability statements on the chances of everything from a Labour plurality to whether the Conservatives retain their seat in Amber Valley.
The success of a forecast depends critically on the information that goes into it, and on the assumptions that relate that information to election day outcomes that are the ultimate quantities of interest. The information we use includes past national and constituency level election results, constituency demographics and geography, plus current national and constituency level polling. We will sketch some of the most important assumptions here, as they are important to understanding why we think we can generate a reasonable forecast.
The national vote share
The national vote shares for each party, while not actually the key outcome of the election, are the quantities for which we have the most historical evidence to utilise. Not only do we have the outcomes of elections, but ukpollingreport.co.uk hosts a record of national (except Northern Ireland) polling in the lead up to every election going back to February 1974. This is useful because it makes it possible to not merely to consider a ‘snapshot’ of what would happen in an election held today, but instead to estimate how predictive polls were in past elections at different distances from election day.
One of the striking patterns in this data is that the major parties tend to drift back towards their result at the previous election, and so a weighted average of the polls and the last election is a better prediction of the upcoming election than the polls alone. As the election approaches, the weight on the polls increases, but even the polls just before election day tend to systematically overstate change from the last election.
We are not the first to observe this fact, and it is important for understanding why Labour is currently up in the polls by 1% on average, but we currently expect the Conservatives to edge them in vote share by about 2% on election day. However, this is just an expectation (an average over the outcomes we think are possible) and our forecast has lots of uncertainty. Labour could very well hold or increase its lead through to election day, or the Conservatives could gain a much more substantial lead of their own. Both of these outcomes are plausible given the history of how much polls change in the months leading up to UK elections.
What about actual seats in Westminster?
How do we translate national vote share into expected local outcomes at the seat level? The traditional solution is uniform national swing: if the Conservatives lose three percentage points across Britain, uniform national swing assumes that they lose three percentage points in each constituency.
Historically this is a good model, at least for the major parties, but it does not work for smaller parties. Instead, we model how support for each party varies across different kinds of constituencies. This modelling depends on having polling data at the constituency level, which includes the Ashcroft constituency polls as well as YouGov polling data disaggregated to the constituency level.
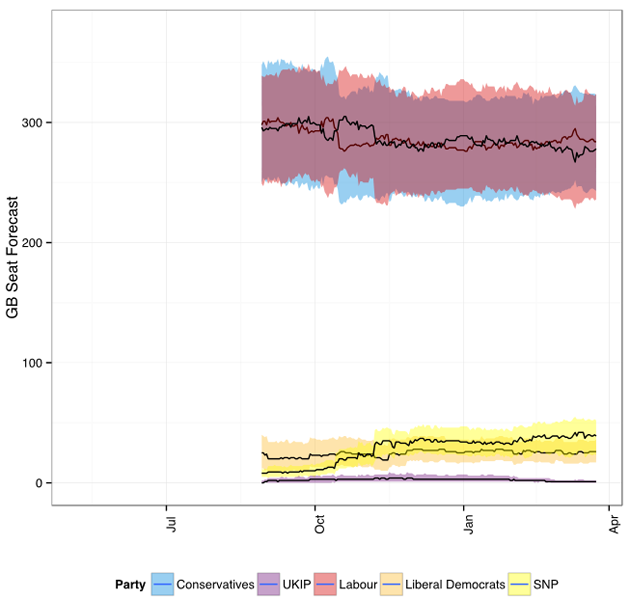
We combine this constituency polling information with data on party support in each constituency at the last election, information about constituency characteristics from the UK census, and historical data on relative turnout. We also impose the requirement that all the constituency predictions add up to the vote forecast. As the graph below shows, this has steadily yielded a forecast with Labour and the Conservatives nearly tied since last September. But as with the vote shares, there is still a great deal of uncertainty this far from the election: this is just the best guess given what we know now.
Testing the model
One thing to note about the forecast is that, except for the SNP, the 90% predictive interval for the seats secured by each party has been stable since September, and many values have been consistently in the interval the entire time. This is an important check on forecasting methodology.
We were forecasting the same event in September that we are forecasting now: the 7 May 2015 general election. If we were forecasting that a certain result was nearly impossible one week, very likely the next, and nearly impossible again the following, that would be a very bad indicator for our method. As it is, the only party whose forecast is really different than it was at the beginning of September is the SNP, whose 90% interval then and now are entirely disjointed. But rare events do happen, and it is not unreasonable to view the spectacular rise of the SNP as a rare event.
There are other ways we can evaluate the methodology as well, even in advance of the actual election result. When we ‘retrocast’ 2010 using a similar approach, using the polling data published before the election, our model performs very well. Our retrocast is closer than any of the forecasts published before that election, but of course we could look at the outcome when designing our model, so this is hardly a fair comparison. But if we could not even do that well, we would have reason to worry.
The other way we check our model is to predict what new constituency polls will show, particularly those of Lord Ashcroft, before they are released. We have been doing this for a few months now, and the results are very promising. Not only are we getting good estimates for previously unpolled constituencies, the forecasting uncertainty is very close to what our model says it should be as well.
There are many, many details not described in the above paragraphs, some of which are discussed in the FAQ on our website, and some of which will have to wait for when we are ready with a paper describing the methodology in detail. It is a complicated model because the UK has complicated electoral politics. We have not even mentioned the entirely separate model we are using to forecast the 18 seats in Northern Ireland. By trying to get all the details right, we hope to be able to forecast the major outcomes more accurately than the more typical strategy of focusing only on the vote and seat totals for the major parties. But there are no guarantees: as with any forecasting exercise we are reliant on our ability to correctly identify which historical patterns are likely to continue without making assumptions that prove to no longer hold.
Our forecasts are posted at electionforecast.co.uk and our daily updates are sent from our Twitter account @Election4castUK.


