
Here's how it works. Google creates a list of all the articles a journal has published in a specified period of time. The citations to each article are counted in order to determine the publication's h-index, which is the largest number "h" such that each of the set of "h" articles were cited "h" or more times. As an example of how the h-index is calculated, consider a publication that has had six total articles having 2, 18, 11, 3, 22, and 9 citations, respectively. This gives the journal an h-index of four. Articles meeting the h-index criterion constitute the h-core. In the example, the core is the articles with 18, 11, 22 and 9 citations. Within the h-core, the median of the citation counts is used to assess the typical influence among the most highly cited set and is reported as the h-median. In the example, the h-median is 14.5.
You might think the "h" of the h-measures was for Helder Suzuki, the Google software engineer who made the blog post unveiling Scholar Metrics. Actually, the "h" refers to Professor Jorge E. Hirsch, a physicist at the University of California, San Diego. Professor Hirsch originally proposed the h-index in 2005 as a means for individual scientists – theoretical physicists, say – to gauge the quality of their work. Hirsch thought total publications, the standard evaluation measure at the time, was a flawed yardstick of a scientist's contributions. In his view, one had to also consider the distribution of citations resulting from a researcher's papers to really know whether that scientist's output was influencing his or her field. And now Scholar Metrics is applying the same idea to the scientific journal.
Scholar Metrics isn't the first tool for evaluating the influence of scholarly publications – Thomas Reuters introduced the impact factor. It is calculated by taking the total number of citations a journal has received in the past year and dividing by the total number of articles it has published in the previous two years. Impact factors are released as part of the annual Journal Citation Reports (JCR). Unlike Scholar Metrics, the JCR is a proprietary service.
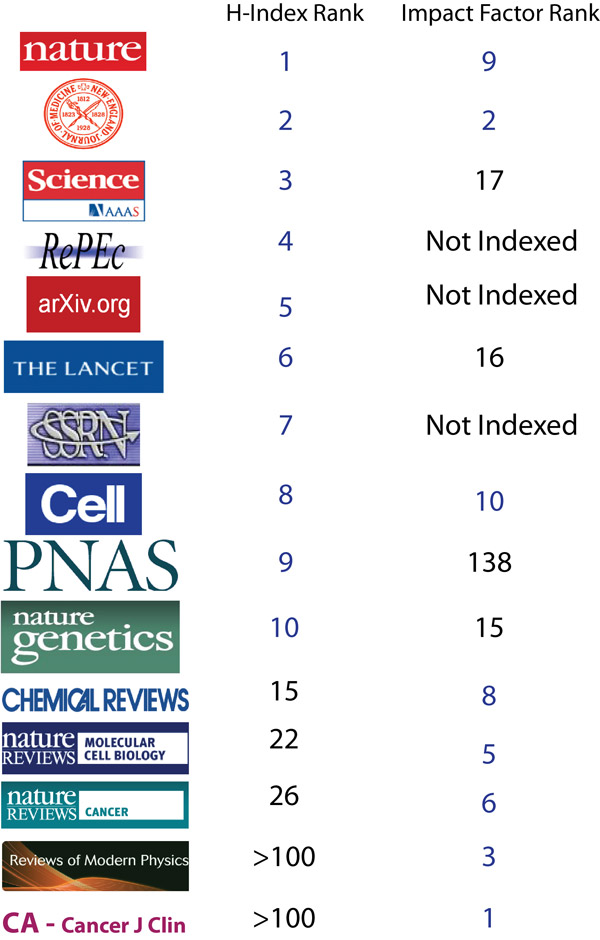
So which is the better measure of a publication's influence, h-index or impact factor? If we look at the top ten distributors by each measure, we find Nature, The New England Journal of Medicine, and Science, the major players we would expect to be at the top of the list, taking the 1, 2, and 3 positions by h-index (Figure below). Not so for 5-year impact factor, which doesn't even include Science in its top 10 or PNAS in its top 100. In their place are a number of publications specializing in reviews, which makes the impact factor seem peculiarly out of touch. Review articles, although much read and frequently cited, are not the papers that shape their fields, and these specialty journals wouldn't even be considered by authors debating where to report their next breakthrough.
Leading journals by five-year h-index (Google Scholar Metrics) and impact factor (Thomas Reuter's JCR).
The main flaw with the impact factor is that it is basically an arithmetic mean and, consequently, sensitive to outliers. Like a megastar that pulls all the lesser celestial bodies towards itself, one highly influential paper can draw the impact factor closer to its own citation count. This could give a distorted sense of the importance of the journal publishing the paper if its other contributions were largely forgettable. Suppose that in the current calendar year, the journal's one-hit wonder had 200 citations and its remaining 10 articles no citations. This would give the journal an impact factor of 18.2, suggesting, misleadingly, that articles it distributed typically receive 18 citations per year. Contrast this with the journal's h-index of 1, an accuracte reflection of the number of highly-cited articles the journal had published.
Another advantage of Scholar Metrics is its inclusion of web repositories like the Social Science Research Network and arXiv, where authors can make manuscripts or published articles available to the web community at no cost to themselves or their readers. By making it into the top 10 of the h-index ranking, these repositories demonstrate the importance of open access and early views in strengthening a publication's sway.
But who needs to continue to list Scholar Metrics' virtues? It's free and it's Google's. Bottom line.
To get started with the service, visit the Google Scholar page. Below the search box of the main page is a link to the metrics service, which in the company's characteristically low-key fashion is labelled simply "New!". All of the current measures are based on a five-year window beginning on April 1st 2007 and the database includes publications in ten languages. Users can browse or search for terms within publication titles, and clicking on the h-index for any specific publication opens up a page with details on the articles and citations statistics constituting its h-core. Curious to know what statistical journal is most influencing its field? The answer is just a click away.


