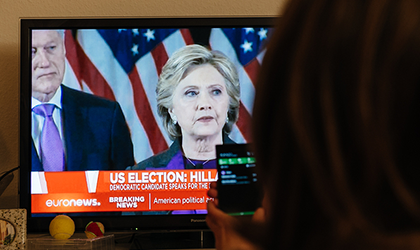

Thirty-six hours later he was President-elect, having won a majority of votes in the Electoral College, even though Clinton won the popular vote.
Billions of campaign dollars had been spent, bookies had taken bets, pollsters had polled and modellers had predicted. But very few saw this coming. In what follows, we compare the performance of the pollsters, the election modellers, academics and betting firms who had tried to forecast what would happen. Who got it right? Who got it wrong? And how accurate were they in their predictions?
The analysis sticks to the approach described in our previous article on the 2012 presidential election. To recap:
- This article will cover predictions made for the two main candidates, Trump and Clinton.
- To deal with those polls and predictors that do include results for third-parties, this article will adopt a two-party forced format in which predictions for these candidates (as well as any undecided voters) will be proportionally reallocated to the official Democratic and Republican candidates.
- The accuracy of predictions will be judged according to the mean absolute error, which is calculated as the average absolute difference between what is predicted and the actual result. An accurate prediction will have an MAE of 0%, while a wholly inaccurate prediction will have an MAE of 100%.
Note that that there are problems with using MAE for a two-party-forced election prediction, since it has no direction and doesn’t differentiate between an underestimate and an overestimate. To get around these problems, this article will also note whether the predictor actually predicted the winner (WIN), assigning a score of 1 if it did and 0 if it didn’t.
The results
The Electoral College will not meet until 19 December 2016 and will not be certified by Congress until 6 January 2017, so the official results are not available at this time. Instead, we will use estimates as of 16 November. They are given below, along with the two-party-forced versions. The WIN parameter designates the winner and the post-facto probability of success.
Table 1. Estimated 2016 US presidential election results as of 16 November.
| Candidate | Party | Popular vote | % | Two-party forced | WIN | Electoral College votes | % | Two-party forced | WIN |
| Trump | Rep. | 61,103,697 | 46.86 | 0.496 | 0 | 306 | 56.9 | 0.569 | 1 |
| Clinton | Dem. | 62,086,517 | 47.62 | 0.504 | 1 | 232 | 43.1 | 0.431 | 0 |
| Johnson | Lib. | 4,257,135 | 3.27 | 0.000 | 0 | 0 | 0.0 | 0.000 | 0 |
| Stein | Green | 1,297,323 | 1.00 | 0.000 | 0 | 0 | 0.0 | 0.000 | 0 |
| Write-ins | – | 671,979 | 0.52 | 0.000 | 0 | 0 | 0.0 | 0.000 | 0 |
| Mullin | – | 513,768 | 0.39 | 0.000 | 0 | 0 | 0.0 | 0.000 | 0 |
| Other | – | 453,487 | 0.35 | 0.000 | 0 | 0 | 0.0 | 0.000 | 0 |
| Total | 130,383,901 | 100.00 | 1.000 | 538 | 100.0 | 1.000 |
The predictors this article will focus on are: nationwide opinion polls; modellers and others; and betting odds. How well did they do?
Nationwide opinion polls
To match the previous article on the 2012 election, the following were selected:
- ABC News/Washington Post (conducted by Langer Research Associates, a phone poll including cellphones);
- CNN (by Opinion Research Corporation, a phone poll including cellphones);
- Rasmussen (by Pulse Opinion Research, LLC, a robocall/internet poll omitting cellphones);
- Reuters (by Ipsos, an internet poll);
- NBC News (by Wall Street Journal & Hart Research Associates, a phone poll including cellphones, or by SurveyMonkey, an internet poll).
Each poll sought to correctly gauge Trump and Clinton’s share of the popular vote. The resulting MAEs (Figure 1) and WINs (Table 2) are given below.
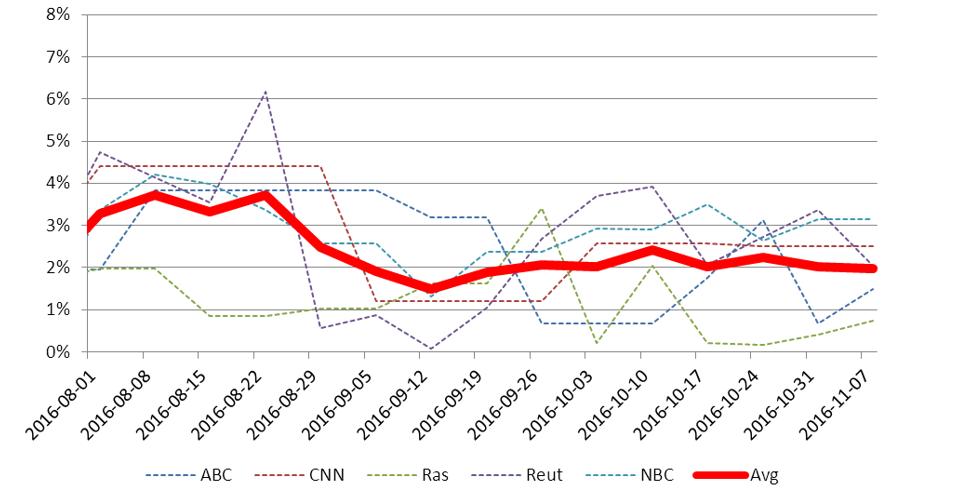
Figure 1. MAEs for polls published on and before 8 November 2016, based on election results as of 16 November 2016. The red line represents the average for all selected pollsters.
Table 2. Predictions (WINs) of who would win the popular vote published on and before 8 November 2016. 1 = Clinton wins, 0 = Trump wins.
| Pollster | Election day | 1 week before | 2 | 3 | 4 | 5 | 6 | 7 | 8 | 9 | 10 | 11 | 12 |
| ABC | 1 | 1 | 1 | 1 | 1 | 1 | 1 | 1 | 1 | 1 | 1 | 1 | 1 |
| CNN | 1 | 1 | 1 | 1 | 1 | 1 | 0 | 0 | 0 | 0 | 1 | 1 | 1 |
| Rasmussen | 1 | 1 | 1 | 1 | 1 | 1 | 0 | 0 | 0 | 0 | 0 | 1 | 1 |
| Reuters | 1 | 1 | 1 | 1 | 1 | 1 | 1 | 0 | 1 | 1 | 1 | 1 | 1 |
| NBC | 1 | 1 | 1 | 1 | 1 | 1 | 1 | 1 | 1 | 1 | 1 | 1 | 1 |
| Total predicting Clinton win (out of 5) | 5 | 5 | 5 | 5 | 5 | 5 | 3 | 2 | 3 | 3 | 4 | 5 | 5 |
In terms of predicting a popular vote winner, our five selections were fairly reliable, with most of them predicting a Clinton win. If Clinton had won the Electoral College as well, the pollsters’ performance would have been seen as acceptable – albeit barely, when judged against a previous analysis of UK general election forecasts.
Modellers and other predictors
Again in line with the previous article, the following were selected:
- Alan Abramowitz’s “Time for Change” model, which uses presidential approval rating, economic factors, incumbency and voting polarisation;
- Robert Erikson and Christopher Wlezien’s “Leading economic indicators and polls” model, which uses economic indicators and opinion polls;
- Ray Fair’s “Economic voting” model, which uses economic indicators and a few non-economic ones;
- Helmut Norpoth’s “Primary” model, which uses votes in the party primaries;
- Nate Silver of FiveThirtyEight’s “polls plus” model, which uses opinion polls plus economic data.
The modellers made predictions for both the popular vote winner, and the Electoral College winner. The resulting MAEs for the popular vote predictions are in Figure 2, predictions for who would win the popular vote are in Table 3, and predictions for who would win the Electoral College vote are in Table 4.
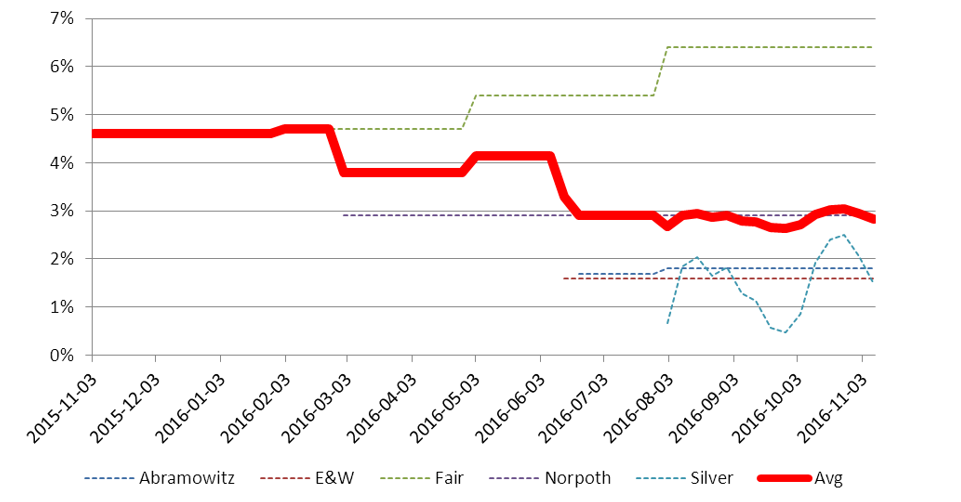
Figure 2. MAEs for modellers’ predictions of who would win the popular vote published on and before 8 November 2016, based on election results as of 16 November 2016. The red line represents the average for all selected modellers.
Table 3. Predictions (WINs) of who would win the popular vote published on and before 8 November 2016. 1 = Clinton wins, 0 = Trump wins.
| Modellers | Election day | 1 week before | 2 | 3 | 4 | 5 | 6 | 7 | 8 | 9 | 10 | 11 | 12 |
| Abramovitz* | 0 | 0 | 0 | 0 | 0 | 0 | 0 | 0 | 0 | 0 | 0 | 0 | 0 |
| E&W | 1 | 1 | 1 | 1 | 1 | 1 | 1 | 1 | 1 | 1 | 1 | 1 | 1 |
| Fair | 0 | 0 | 0 | 0 | 0 | 0 | 0 | 0 | 0 | 0 | 0 | 0 | 0 |
| Norpoth | 0 | 0 | 0 | 0 | 0 | 0 | 0 | 0 | 0 | 0 | 0 | 0 | 0 |
| Silver | 1 | 1 | 1 | 1 | 1 | 1 | 1 | 1 | 1 | 1 | 1 | 1 | 1 |
| Total predicting Clinton win (out of 5) | 2 | 2 | 2 | 2 | 2 | 2 | 2 | 2 | 2 | 2 | 2 | 2 | 2 |
*Abramowitz’s model predicted a Trump win, but he disavowed it. We took the model, not the modeller.
Table 4. Predictions (WINs) of who would win the Electoral College vote published on and before 8 November 2016. 1 = Trump wins, 0 = Clinton wins.
| Modellers | Election day | 1 week before | 2 | 3 | 4 | 5 | 6 | 7 | 8 | 9 | 10 | 11 | 12 |
| Abramowitz*+ | 1 | 1 | 1 | 1 | 1 | 1 | 1 | 1 | 1 | 1 | 1 | 1 | 1 |
| E&W | 0 | 0 | 0 | 0 | 0 | 0 | 0 | 0 | 0 | 0 | 0 | 0 | 0 |
| Fair+ | 1 | 1 | 1 | 1 | 1 | 1 | 1 | 1 | 1 | 1 | 1 | 1 | 1 |
| Norpoth | 1 | 1 | 1 | 1 | 1 | 1 | 1 | 1 | 1 | 1 | 1 | 1 | 1 |
| Silver | 0 | 0 | 0 | 0 | 0 | 0 | 0 | 0 | 0 | 0 | 0 | 0 | 0 |
| Total predicting Trump win (out of 5) | 3 | 3 | 3 | 3 | 3 | 3 | 3 | 3 | 3 | 3 | 3 | 3 | 3 |
*Abramowitz’s model predicted a Trump win, but he disavowed it. We took the model, not the modeller.
+Fair and Abramowitz’s models predicted a Trump popular vote share win but did not explicitly predict a Trump Presidency. This analysis infers the latter from the former.
Here, the picture is more mixed. The majority of the five selections did not predict that Clinton would win the popular vote and their MAEs were larger than the polls. Their predictions of the Electoral College winner (whether explicit or implicit) were closer to the outcome, but they were unsure and Abramowitz disavowed his own model.
Betting odds and spreads
To match the previous article on the 2012 election, the following were selected:
- Betfair: a London-based bookie that covers both fixed-odds and exchange betting (as “Betfair Exchange”);
- Ladbrokes: a London-based bookie that covers fixed-odds;
- William Hill: a London-based bookie that covers fixed-odds;
- PaddyPower: a Dublin-based bookie that covered fixed-odds. Merged with Betfair in 2016.
Bets pay out if the chosen candidate gains a projected majority in the Electoral College (and hence wins the presidency), not if the chosen candidate wins the popular vote. Consequently, if we compare the bookies’ probabilities to the result, then the resulting MAEs are:

Figure 3. MAEs for bookies’ predictions of who would win the Electoral College vote published on and before 8 November 2016, based on election results as of 16 November 2016. The red line represents the average for all selected bookies.
The WINs don’t need to be shown. Throughout the campaign, the bookies just didn’t see a Trump victory coming. Any way you look at it, this is an awful performance.
Conclusion
Judging from the early commentary, the 2016 US presidential election will be seen as the latest in a series of elections in which the forecasters got it wrong. This is both fair and unfair, and it needs to be understood why.
The pollsters are being excoriated for not predicting the Trump presidency, but they can legitimately claim in their defence that they predicted a win for Clinton in the popular vote: as Lynn Anderson sang, “they never promised you a Rose Garden”. Pollsters cannot be blamed for failing to predict a Trump presidency because they don’t predict presidencies, just the vote… although one suspects that this defence will not find universal favour.
As for accuracy in predicting vote share, the picture is mixed. Some characterise the nationwide polls as a miss or a real error, others state that they may be more accurate than previous elections (see here and here). Millions of ballots remain uncounted and the totals at the time of writing will not be the same when Congress meets in January. So it is too early to tell.
Regardless of how well the nationwide opinion polls did, the statewide polls must be mentioned. States are not statistically independent, and polling errors in one state are likely to be reflected in similar states. In 2016, the polling errors were spread unevenly, with Trump outperforming his polls in Midwestern states like Iowa, Ohio, Pennsylvania, Michigan, Wisconsin and Minnesota. This had implications for the Electoral College, with states that flipped from Obama to Trump proving crucial to the latter’s victory.
The modellers had a mixed war. Helmut Norpoth correctly predicted a Trump presidency: his Lebo/Norpoth model based on leader ratings may have correctly predicted the 2015 UK general election had he kept faith with it unaltered, and (despite adjustments to include South Carolina) he stuck to his Primary Model for the 2016 presidential election and correctly predicted Trump several months out. Alan Abramowitz had the reverse problem: his “Time for Change” model predicted a Trump win in the popular vote and presumably the presidency, but he disavowed it. To avert an unkind interpretation that he simultaneously predicted a Trump popular vote win and a Clinton presidency, we have taken the prediction of the model not the modeller. As for Nate Silver, simultaneously criticised for being too anti-Clinton and too unsure, the author has only sympathy and notes his vindication.
The bookies had a profitable night, but that’s the most that can be said for them. The popular conceit that odds predict outcomes because punters bet real money is a fallacy. Even when odds correctly predict the winner their errors are large, and when they predict the wrong winner the size of their errors are, to quote President-elect Trump, “huge”.
- Timothy Martyn Hill is a statistician who used to work for the Office for National Statistics and now works in the private sector.
- A full version of this analysis, with appendices and in-line citations is available here.


