
In order to try to help understand what this world of genres is like, I've made a map of it called Every Noise at Once. This map is algorithmically generated, not hand-built by me so I can regenerate it dynamically as we discover new genres, as genres morph, new music appears and the popularity of any bits of it ebb and flow.
The amount of data that affects this map directly or indirectly is so vast that explaining the entire chain of collection and inference and calculation and calibration in specific detail is essentially impossible. But the map itself attempts to sublimate all that complexity into something you can actually use without your head exploding.
The layout of the map is essentially a readability-adjusted scatter plot. Genres towards the bottom are more organic and acoustic, genres towards the top are more mechanical and electric. Genres towards the left are more dense and atmospheric, genres towards the right are sparer and bouncier. These qualities are quantified and measured at the song level by our audio analyses, and then aggregated computationally by genre. There are actually 12 dimensions to our complete underlying analysis, but these two seemed to produce the most intelligible visual distribution.
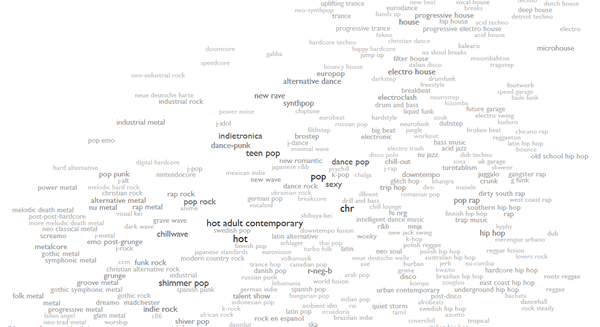
Click a genre and you can hear an example song (also selected automatically based on small mountains of data and deduction). Click the little » next to a genre and you can see a similar map of some of the most representative artists in that genre, and click on any of those to hear an example (hopefully) of that artist's work in that genre.
Like most computational processes based on human data and human love, this one doesn't always work perfectly. Some of the genres that end up as neighbors on the map don't sound all that similar to human listeners. Some of the deductions the math makes are based on confused or erroneous data. Some of the songs are not ideal demonstrations of what they are trying to explain. Some of the internal checks and balances to mitigate wrong things also invisibly eliminate a few good things. None of this is intended to replace people loving music and sharing it with each other.
But real maps aren't always perfect, either. The surprising thing is how well the whole thing works, despite all its inevitable flaws and binary obtusenesses. And replacing people is the opposite of the goal anyway. All our measurements and calculations, sorting and mapping are attempts to make more love possible. We can't and don't want to tell you what to love, but we can help you find things you might love that you might never before have even known. We do not want to reduce wonder to numbers, we want to use math, statistics and CPU cycles to link a million lonely wonders into a connected network of wonders and awestruck paths. And maybe one of those paths through the music and math will take you to your new favorite place.
This article first appeared on Glenn's furialog personal blog.


