
After defeating Joseph Parker in 2018, British boxing superstar Anthony Joshua, a 2012 Olympic gold medallist and unified heavyweight champion of the world, stood before his fans and announced, “The old saying is, the right hand could take you around the block, but a good jab will take you around the world.”
A good jab
In boxing, jabs are straight punches thrown by the lead hand. Indeed, many of boxing’s greats had masterful jabs. Floyd Mayweather is a prime example, using his “piston-like” jab to deal damage, manage distance, control the pace, and set up more powerful punches (such as crosses, hooks, and uppercuts). However, after watching Canelo Alvarez defeat Caleb Plant in 2021 by practically only throwing power punches (Table 1) to become the first undisputed super middleweight champion of the world and cement himself as one of Mexico and the world’s greatest boxers of all time, I began to wonder if “the old saying” was still true.
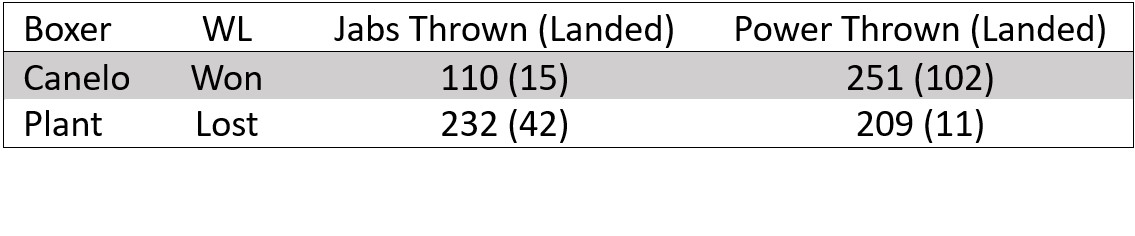
Table 1: The number of jabs and power punches thrown and landed by Canelo Alvarez and Caleb Plant in their 2021 title fight.
In this article, we will apply different statistical models to explore the relationship between a “good jab” and being taken “around the world.” We define a “good jab” as the number of jabs landed in a fight and being taken “around the world” as winning at the highest level of boxing: the 263 men’s boxing fights tracked by CompuBox since 2015. We will consider the assumptions made by these different statistical models and utilise two different approaches for model selection, a data-driven approach and a logical approach based on our prior knowledge of boxing and statistics. By the end of this article, we hope to learn: Can a good jab really take you around the world?
Model 1: Will landing more jabs help you win?
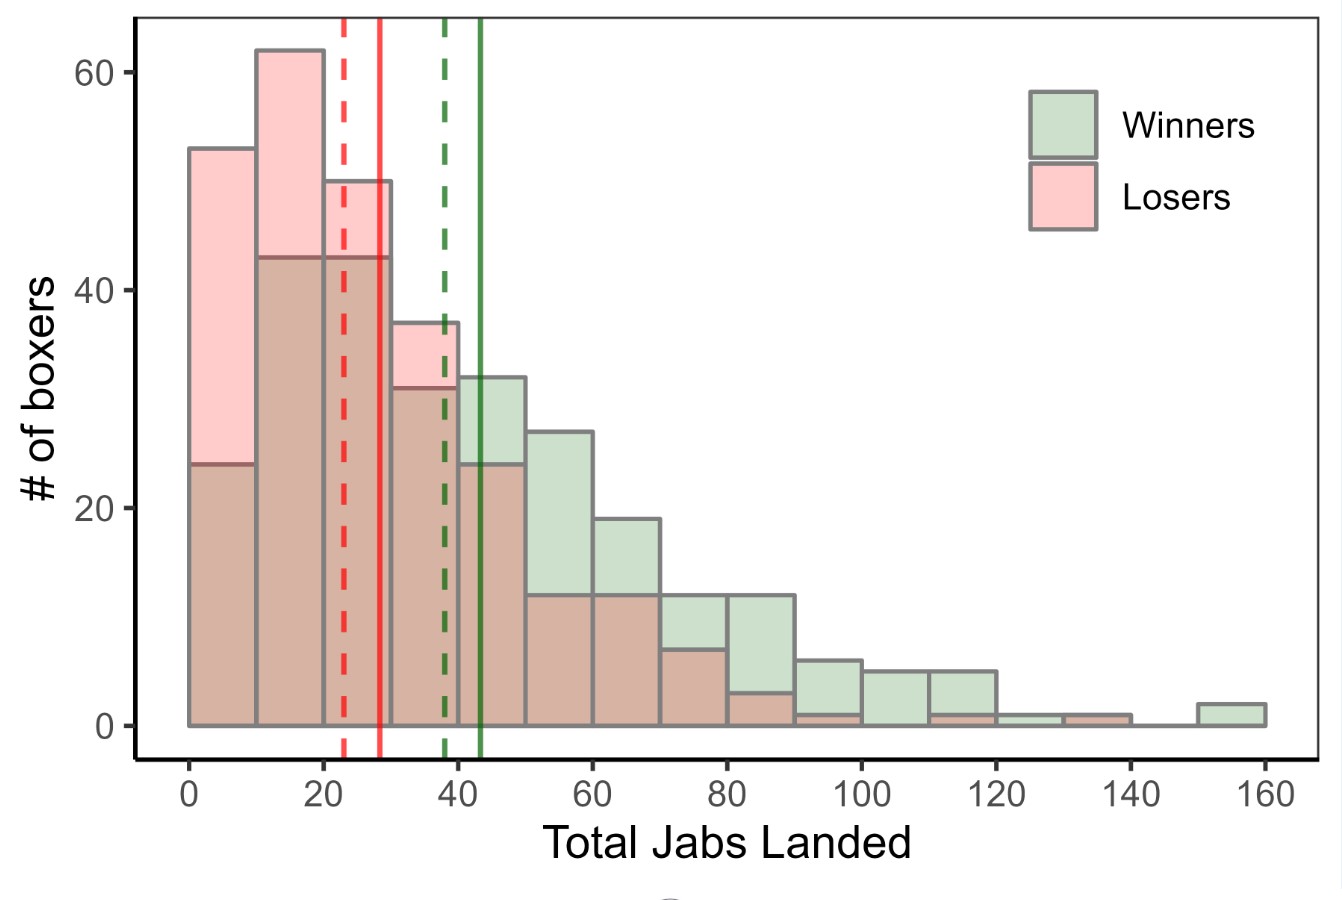
Figure 1: Histograms of the number of boxers (on the y-axis) that landed a given number of jabs (on the x-axis), with the green and red histograms corresponding to winners and losers, respectively. The mean (solid lines) and median (dotted lines) for both winners (green) and losers (red) are included.
Looking at the histograms, means, and medians for winners and losers in Figure 1, it visually appears that winners generally land more jabs. However, will landing more jabs make you a winner? We can start considering this by mapping out the causal relationship between a good jab and winning using a DAG (directed acyclic graph)1,2. In Figure 2A, we use a DAG to depict Model 1, where a “Good Jab” helps a boxer “Land Jabs” which ultimately determines whether he will “Win.” We will describe the DAGs in Figures 2B and 2C in the subsequent sections.
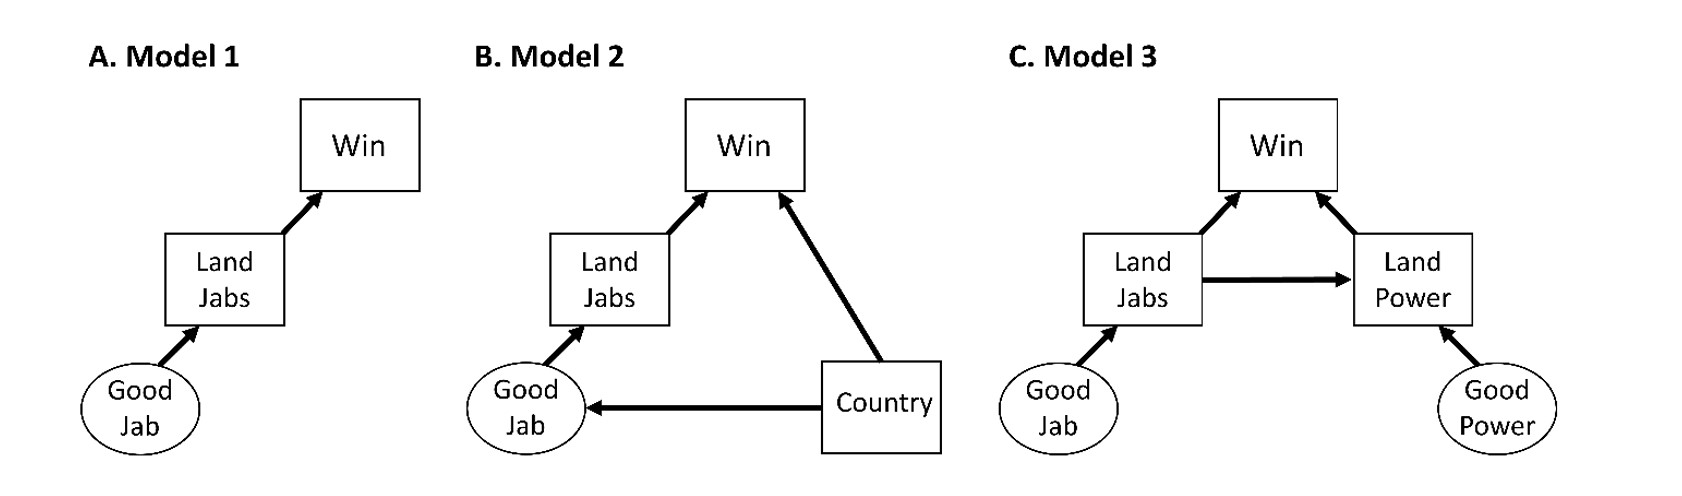
Figure 2: Directed Acyclic Graphs (DAGs) demonstrating the effects of different variables on winning a fight. Rectangles represent measured variables and ovals represent unmeasured variables. Arrows represent the direction of the effects.
For Model 1, we can test the effect of a good jab on winning a fight with logistic regression3, 4, 5. With logistic regression, we can use the number of jabs landed to linearly predict the log-odds of winning:
We won’t go into too much depth in explaining the details of the logistic regression. For the purposes of this article, the primary focus is on the value increase in the log-odds of winning for every jab landed. This is referred to as the log-odds ratio of the number of jabs landed. Simply, a higher positive log-odds ratio indicates a stronger effect of a “Good Jab” on winning a fight, whereas a log-odds ratio of 0 indicates no effect. Readers who are interested in learning more about the logistic regression can consult some introductory journal articles4, 5 and online blog posts for more intuition and understanding.
In Model 1, the log-odds ratio for number of jabs landed is 0.024. In other words, the log-odds of winning increases by 0.024 for every jab landed. Considering that the average number of jabs landed in our data is around 40, then landing an average number of jabs raises a boxer’s log-odds of winning by 0.024 x 40 = 0.96 and their odds of winning by e0.034*40 = 2.61 times. If a boxer wants to improve their odds of winning a fight, landing more jabs seems to be a pretty good strategy!
How do we know if this result is statistically meaningful? We can determine this by using the 95% confidence interval. With a 95% confidence interval, we report the interval of estimates that we are 95% confident contains the true result. As mentioned earlier, if the number of jabs landed truly does not influence the log-odds of winning a fight, the change in log-odds of winning should be 0. In this case, the 95% confidence interval is (0.036, 0.031). Since this 95% confidence interval does not contain 0, we can be 95% confident that each jab a boxer lands does meaningfully improve his odds of winning!
With logistic regression, a good jab is modeled as a predictor of winning or losing. Accordingly, we can also consider whether including additional variables can help predict if a boxer will win and ultimately give us a better idea of the jab’s true importance.
Model 2: VIVA MEXICO!
There’s a question some readers may have been asking since I used Canelo as an example. Mexican boxers like Canelo are known for “all out attacks at the expense of defense, a badge of honor, and a promise of fireworks in the ring”6. Stylistically, Canelo embodies many of these qualities that have propelled Mexican boxers to the highest level.
Boxers differ greatly in fighting style based on their countries of origin. The British, Mexican, Cuban, American, and Eastern European boxing styles are all famously distinct and differ in their usage of the jab. We can build on Model 1 (Figure 2A) by including each boxer’s “Country” of origin in Model 2 (Figure 2B). The DAG in Figure 2B shows that “Country” can both influence whether a boxer has a “Good Jab” and whether he “Wins” (via other factors such as boxing style, mentality, etc). In this case, “Country” is referred to as a confounder because it influences both the predictor of interest and the outcome. Luckily, we can control this confounding by including country of origin as a variable in our logistic regression.
When controlling for country of origin in Model 2, the log-odds ratio is 0.023 for every jab landed, with a 95% confidence interval of (0.015, 0.031). These estimates resemble the estimates we observed in Model 1 and are also statistically significant!
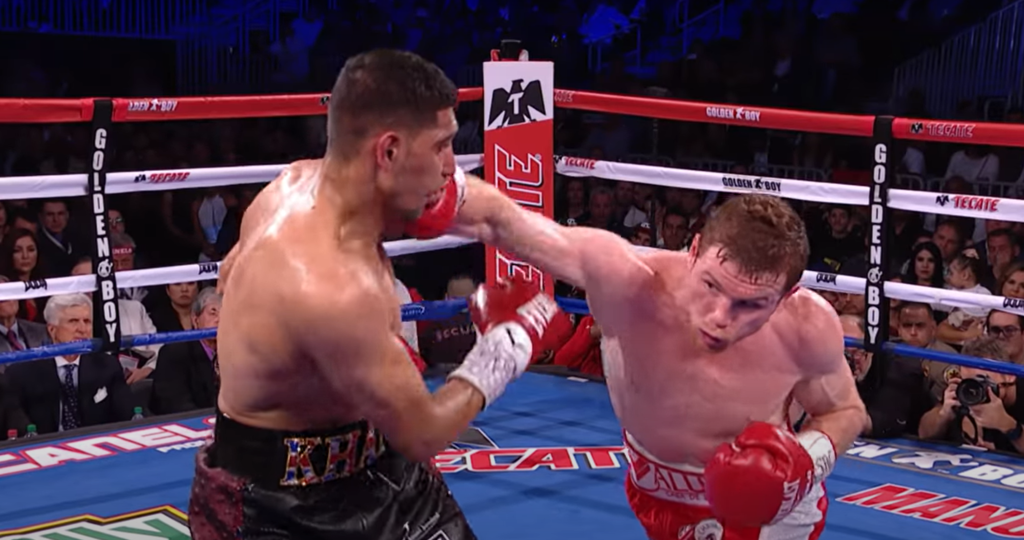
Canelo Alvarez (right) fights Amir Khan on 7 May 2016
Model 3: It ain’t about how hard you can hit
While Canelo didn’t land many jabs against Caleb Plant, he compensated by landing more power punches, which ultimately determined the outcome of the fight (Table 1). Some boxers, like Canelo, can land more power punches by simply having good power punches. Alternatively, landing more jabs can also help a boxer set up and land more power punches.
We demonstrate this relationship between having a “Good Jab” and “Good Power” punches with the DAG in Figure 2C. Along with directly helping a boxer win, landing jabs (“Land Jabs”) can also indirectly help a boxer win by helping him set up and land more power punches (“Land Power”) (Figure 2C). These are referred to as the direct and indirect effects of having a good jab on winning a fight, and landing more power punches (“Land Power”) is referred to as a mediator for this indirect effect (Figure 2C). By controlling for the number of power punches landed as a mediator in Model 3, we can separate the direct and indirect effects of having a good jab and explore whether the jab is more important than power punches as Anthony Joshua and “the old saying” imply.
In Model 3, the log-odds ratios are 0.021 for every jab landed and 0.004 for every power punch landed, with 95% confidence intervals of (0.013, 0.029) and (0.002, 0.007), respectively. Again, the relationship between jabs and winning closely resemble what we observed in Model 1. Even when controlling for the number of power punches landed, the direct effect of a good jab is still a statistically meaningful predictor of whether a boxer wins or loses a fight.
Model selection: We go to the score cards
With these three logistic regression models, some readers may be asking themselves, “Which model should I use?” That’s a good question. Perhaps we can use the data to help us make a decision7. Typically, we want the model that best fits the data. However, we also want a simpler model with fewer parameters. In statistics, this preference for simpler models is called parsimony. Here, we can use the Akaike information criteria (AIC) to balance model fit against parsimony when comparing similar regression models with different coefficients8. In such an exploratory analysis, we want the model that has the lowest AIC value. The AIC values for Models 1, 2, and 3 are: 689, 713, and 681, respectively. In this case, we would select Model 3 and use both the number of jabs and power punches landed to predict the outcome of the fight (Figure 2C). Following this data-driven model selection, more data may be collected to further clarify the relationship between jabs and power punches on winning7.
Model 4: It’s just you and the other guy
Alternatively, we can make judgements on how to model the data based on our prior knowledge of boxing and statistics7. Here, we have data from different fights, but ultimately, these fights are between two boxers. As the boxing legend Joe Louis said, “Once that bell rings, you’re on your own. It’s just you and the other guy.” Whether a boxer wins or loses isn’t just dependent on how many punches they land, but also on how many punches they land compared to their opponent. How can we account for this in our analysis?
Furthermore, our prior knowledge of boxing, statistics, and the questions we’re interested in answering can help us decide which variables we should adjust for in our analysis. Since we want to compare the importance of the jab with power punches, we should include power punches as a mediator (Figure 2C). We also want to control for relevant confounders. Earlier, we described how boxers from different countries can have country-specific boxing styles that can confound the relationship between jabs and winning a fight (Figure 2B). However, boxers can also have different styles based on other characteristics such as their size, reach, strength, and more.
Ultimately, “styles make fights,” where a boxer’s style can provide different advantages and disadvantages depending on their opponents style. Joe Frazier defeated Muhammad Ali in the 1971 “Fight of the Century.” Two years later, “down goes Frazier,” George Foreman defeated Joe Frazier in the 1973 “Sunshine Showdown.” Finally, Muhammad Ali defeated George Foreman in the 1974 “Rumble in the Jungle,” completing the cycle. Each of these legendary boxers had different underlying characteristics and styles, potential confounders, that put them at an advantage against one boxer and a disadvantage against the other. How will we ever know if we’ve controlled for all the relevant confounding variables? Furthermore, just knowing what variables to include isn’t enough. We also need to measure these variables. Despite our best efforts it is often the case that some important variables remain unmeasured.
Fortunately, we can perform within-fight comparisons of the relationship between having a “Good Jab” and “Good Power” punches on winning the fight by using a conditional logistic regression. The conditional logistic regression asks that, given there is only one winner in a fight, what is the probability that Boxer A won and not Boxer B? Usefully, such within-fight comparisons only compare the two boxers within a given fight and controls for all measured and unmeasured matchup-level time-invariant confounders8.
With Model 4, the conditional logistic regression, we observe that the log-odds ratios (and 95% confidence intervals) for every jab and power punch landed are 0.028 (0.016, 0.039) and 0.027 (0.019, 0.037), respectively. The increase in log-odds of winning for every jab landed still resembles that of the earlier models. However, landing power punches now appears to have a greater influence on a boxer’s log-odds of winning a fight. Interestingly, the log-odds ratios are now nearly equal for every jab or power punch landed. It appears that a good jab will take you around the world, but a good power punch will also similarly suffice.
All models are wrong
In this article, we’ve explored increasingly complex models for evaluating the relationship between having a good jab and winning at the highest level of men’s boxing. The results from Models 1 through 4 are presented in Table 2. However, there are even more potential models that we haven’t explored in this article and more research would be needed to confirm which model is “best.”
So how can we be 100% certain that we’ve chosen the correct model? We never will be. Are we violating any model assumptions? We probably are. Are there ways of addressing these violations? There might be. If there isn’t, perhaps you can be the bright-eyed statistician that finds the solution. These questions will always remain in statistics and data analysis.
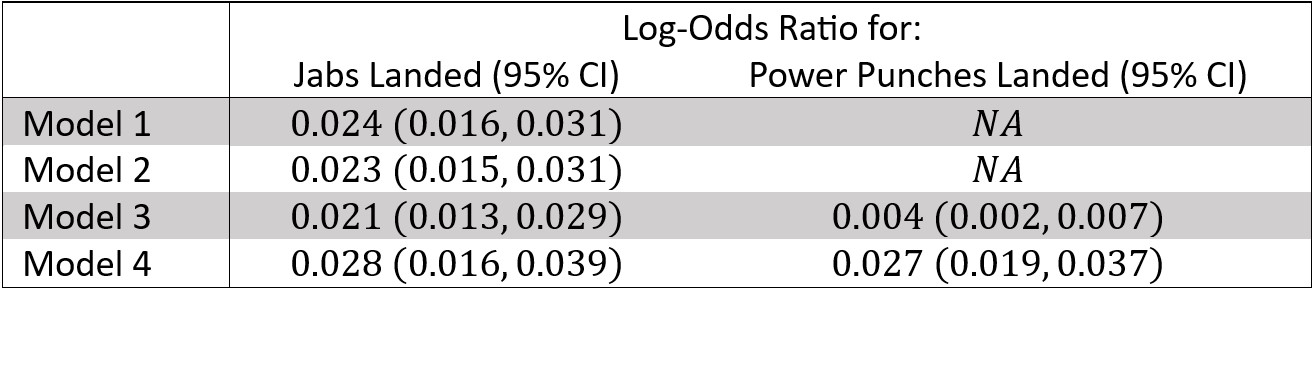
Table 2: The log-odds ratios and their 95% confidence intervals for the number of jabs and power punches landed from Models 1 through 4.
We began this article with a famous boxing quote, popularized by a British boxer, and we will end it with a famous statistics quote, popularized by a British Box. Award-winning British statistician George E. P. Box famously stated, “All models are wrong, but some are useful.” A statistical model can never perfectly capture all the complexity of reality, nor does it need to. A statistical model just needs to be good enough for our purposes. In this case, all the models explored here are useful and point to the same conclusion: A good jab can indeed take you around the world. But is the jab more important than power punches as Anthony Joshua and “the old saying” imply? Looking at Table 2, Model 3 scores it in favor of the jab, while Model 4 scores it a draw.
How do you score it?
References
1. Digitale, Jean C., Jeffrey N. Martin, and Medellena Maria Glymour. 2022. “Tutorial on Directed Acyclic Graphs.” Journal of Clinical Epidemiology 142: 264–67.
2. Suttorp, Marit M. et al. 2015. “Graphical Presentation of Confounding in Directed Acyclic Graphs.” Nephrology Dialysis Transplantation 30(9): 1418–23.
3. Agresti, Alan. 2002. Categorical Data Analysis. Hoboken, NJ, USA: John Wiley & Sons, Inc. http://doi.wiley.com/10.1002/0471249688 (February 24, 2021).
4. Kleinbaum, David G., and Mitchel Klein. 2010. “Introduction to Logistic Regression.” In Logistic Regression, Statistics for Biology and Health, New York, NY: Springer New York, 1–39. http://link.springer.com/10.1007/978-1-4419-1742-3_1 (May 12, 2023).
5. Park, Hyeoun-Ae. 2013. “An Introduction to Logistic Regression: From Basic Concepts to Interpretation with Particular Attention to Nursing Domain.” Journal of Korean Academy of Nursing 43(2): 154–64.
6. Gomez, Eric. 2021. “The Secret to Canelo’s Success? His Own Brand of Mexican Style.” ESPN.com. https://www.espn.com/boxing/story/_/id/31381706/the-secret-canelo-alvarez-success-crafting-own-brand-mexican-style-boxing (May 17, 2023).
7. Berk, Richard, Lawrence Brown, and Linda Zhao. 2010. “Statistical Inference After Model Selection.” Journal of Quantitative Criminology 26(2): 217–36.
8. Weisberg, Sanford. 2014. Applied Linear Regression.
9. Allison, Paul D. 2009. Fixed Effects Regression Models.
Kenneth Menglin Lee is a biostatistics PhD candidate at Duke-NUS Medical School, Singapore. This article was shortlisted for the 2023 Statistical Excellence Award for Early Career Writing.


