
I had the pleasure of travelling to Boston, Massachusetts, earlier this month to attend the Joint Statistical Meetings (JSM). I was also fortunate to be able to fit in a day of sightseeing before the JSM started. While walking the city’s famous Freedom Trail, I found myself in Faneuil Hall – a marketplace and meeting hall that heard many inspirational speeches in the lead up to the American Revolution. When I visited, however, the Hall was filled with the voices of shoppers buying books about the revolution, boxes of salt water taffy and t-shirts bearing the slogan ‘Boston Strong’.
Boston Strong was coined and widely adopted following the 2013 Boston Marathon bombing, which left three people dead and 264 injured. The Boston Globe’s Ben Zimmerman described it as 'the phrase that rallied a city'. He wrote: 'In its ubiquity, ‘Boston Strong’ presents a united front in the face of threat'.
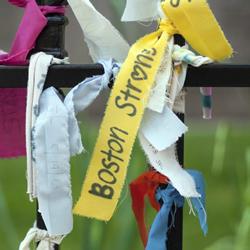
The slogan is frequently seen, and not only on t-shirts – serving as a reminder of the trauma of that day in April and the way the city dealt with the aftermath.
I was reminded again of those things during my first JSM session, in a paper titled ‘Completing the results of the 2013 Boston Marathon’, which was presented by Francesca Dominici, a professor of biostatistics at the Harvard School of Public Health.
Dominici explained how, after the bombs went off and the Boston Athletic Association (BAA) called time on the race, 5,700 runners – of more than 23,000 competitors – were left unable to finish.
For those who did not finish but wanted to compete again the following year, a finishing time was needed to meet the qualifying criteria. So BAA head coach Michael Pieroni contacted Richard Smith, the director of SAMSI, part of the statistics and operation research department at University of North Carolina-Chapel Hill, requesting help.
Pieroni wanted to know whether data from past races, as well as split-time data up to the point at which the 2013 marathon was stopped, could be used to predict the likely finishing times of those who did not finish (DNF).
For 80% of those 5,700 runners, there was split-time data up to 40km – just two-and-a-bit kilometers away from the end of the race. Another 9.5% of the runners were stopped at the 35–40km mark, while 8.2% were stopped at 30–35km. In addition, Pieroni was ready to furnish Smith with full completion data for the 2010 and 2011 races.
Smith agreed to help out, and put together a team including SAMSI colleague Dorit Hammerling and Dominici. As a keen marathon runner, Dominici had competed in the 2013 race, as had Hammerling. Speaking at the JSM, Dominici said: “We felt this was something good we could do.”
With the goal of developing the most accurate prediction algorithm possible, the team set about analysing the data – and quickly realised that estimating split-times towards the end of the race wouldn’t be easy. At this point in the marathon, they saw much more variability in the times people were running, with last-minute spurts and slowdowns complicating matters. At the start of the race, speeds were much more consistent.
Several models were put to the test, starting with the most basic, ‘constant pace’, which calculated the average minutes per runner per mile to extrapolate to the finish line, through to linear regression and a k-nearest-neighbour (KNN) model, which involved searching the older BAA datasets for runners with split-times similar to the 2013 DNFs to use as the basis for predictions.
A validation dataset was created using the 2010 and 2011 data. For both years, 5,700 runners were extracted and the same missing split-times as in the 2013 data were removed. Each model was then tested to see which came closest to predicting the recorded outcomes.
KNN was shown to have the lowest mean absolute error, though younger runners, faster runners and female runners were predicted more accurately than older, slower and male racers.
'We reported a set of times, based on KNN, to the BAA within three weeks,' said Dominici. The BAA, however, decided to use a ‘constant pace’ projection. In a PLOS ONE paper detailing the work, the team wrote: 'In the end, we can understand the BAA's decision to adopt an approach that is easier to explain and defend, though they acknowledged that our results were informative in helping them make that decision.'


