

Ian Timæus, professor of demography at the London School of Hygiene & Tropical Medicine, writes: The answer to this question depends on what happens to international migration. Some 650,000 long-term immigrants arrived in the United Kingdom in 2014, but only about 325,000 emigrants left the country. Thus, the population grew by almost one third of a million as a result of migration. If this inflow of migrants was to continue after the current residents of the country stopped having babies, the population would never drop to zero.
If immigration stopped as well, however, the population would eventually die out. The clue as to how long it would take to do so lies in that expression – ‘die out’. Ten years after women stopped having babies there would be nobody in the UK aged less than 10; after 50 years there would be nobody left aged less than 50; and after 100 years everybody remaining would be a centenarian.
The last person left alive in the UK would be somebody born shortly before childbearing stopped who went on to survive to a very advanced age. Let’s ignore the practical problems facing the increasingly elderly population as they struggle to keep some sort of economy operating and assume that the death rate does not increase. The number of people surviving beyond age 110 has been growing slowly and the oldest person alive in the UK when this was written was 113. However, possibly the oldest person ever, Jeanne Calmont, died at 122. Thus, assuming survivors could get food and basic services, the date when the population dropped to zero would almost certainly be between 110 and 125 years after childbearing stopped.
If immigration was to continue, however, the size of the resulting population would depend on whether or not immigrants also stopped having babies as soon as they arrived in the United Kingdom. If they did, the population would shrink rapidly even though it would never drop to zero.
Demographers predict future populations using a series of calculations known as a cohort-component projection. The method starts with the baseline number of men and women of each age and projects them forward in yearly (or sometimes five-yearly) steps. The results depend on what is assumed about future age-specific death rates, birth rates and migration during each step. For example, the starting point for projecting the population aged 30, 20 years into the projection, is the number of 10-year old children in the baseline year. Moreover, projected births in any future year depend on the size of the population of women of childbearing age in that year.
Thus, the strength of a cohort-component projection is that it uses information on the ages of the current population to reduce uncertainty in the forecasts. It is a cohort projection because it considers each age cohort separately and a component projection because it forecasts the three components of demographic change – births, deaths and migrants – individually, rather than overall population growth.
What happens if one projects the future population in this way, assuming zero births? We can illustrate this using a simplified version of the model that the Office for National Statistics (ONS) uses to produce the official population projections for the United Kingdom. The projections shown here make the same assumptions as ONS about both migration in the long-term (net inward migration of 185,000 a year) and mortality decline during the next 30 years. After 2045 the age-specific death rates are held constant.
The current population of the UK is 65.1 million (see Figure 1). Assuming no births but continuing immigration at the current rate, the UK population would halve in size by the early 2080s and would eventually shrink to 19 million once all of the current population had died. As the population pyramid based on this projection shows (Figure 2), the population in the middle of the next century would have a very different age distribution from the current population. This is because most people who migrate between countries do so as young adults.
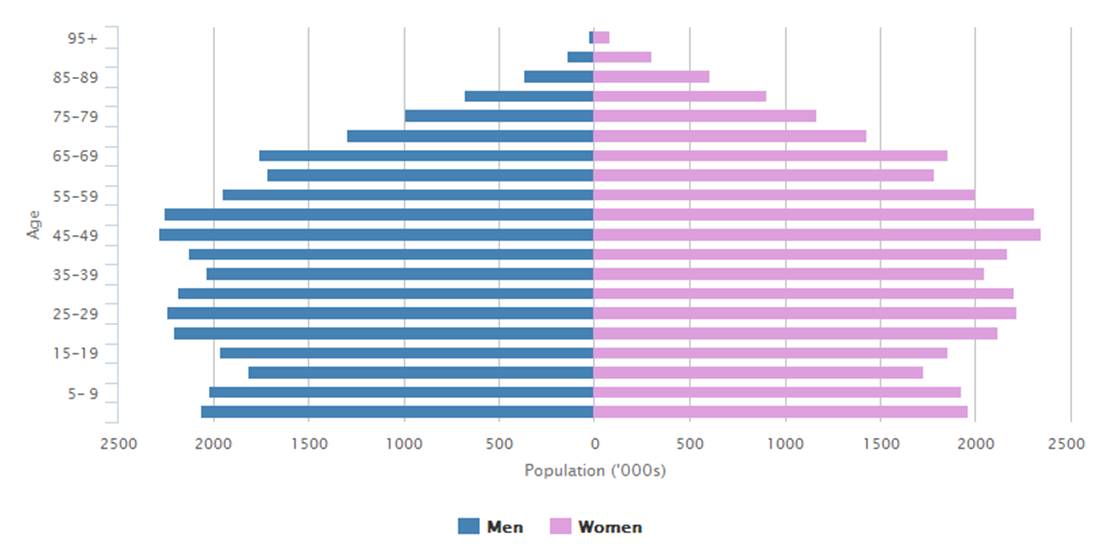
Figure 1. Population of the United Kingdom, 2015
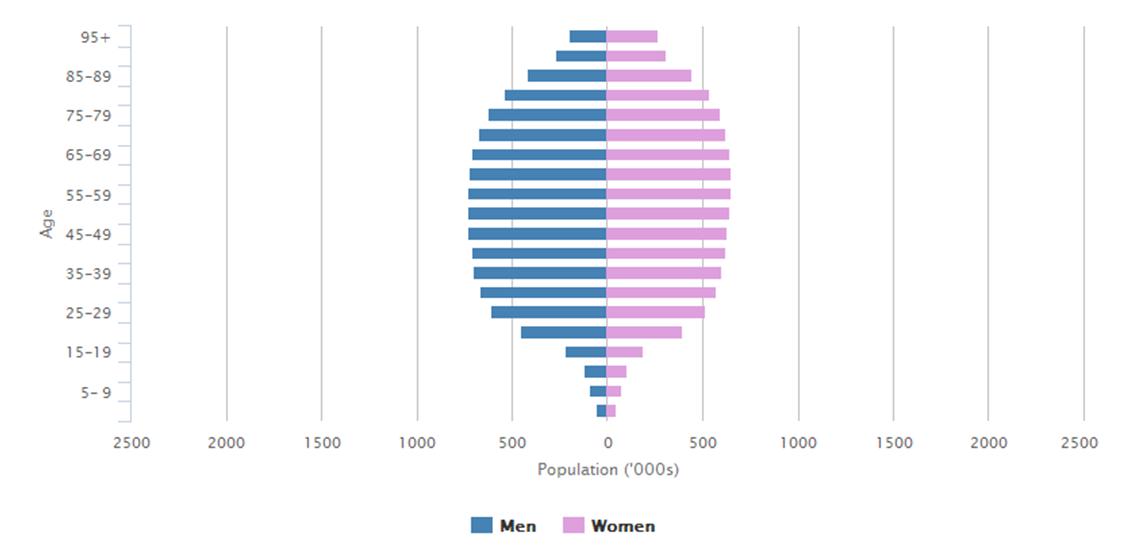
Figure 2. Projected population of the United Kingdom, 2140, assuming no births after 2015, but a continuing net inflow of immigrants
One can also use a population projection to calculate what would happen if immigrants who arrive after the resident population has stopped having babies continue to have babies, rather than stopping as well. For example, one can work out whether and when the population would regain its initial size.
The projection presented here assumes that the birth rates of immigrants are the same as those of the resident population at present. These result in a mean family size of 1.89 children per woman of reproductive age, which is the current rate in the UK. It also assumes that, to begin with, two-thirds of emigrants are return migrants, who immigrated earlier and continue to have babies, and one third of them members of the currently resident population who have stopped childbearing. The latter group of emigrants shrinks as the group who have stopped having babies grows older and eventually dies.
In this scenario, the population of the UK develops a mushroom-shaped age distribution because so few children are born relative to the size of the adult population. It shrinks in size, but remains a lot larger than if the immigrants were also to stop having babies. The population reaches a minimum of 46 million in 2095 and then starts to grow again, as childbearing by the descendants of immigrants compounds the impact of immigration itself. By 2140 the population has risen to 61.4 million.
Projected population of the United Kingdom at 25 year intervals, assuming no births among the currently resident population after 2015, but a continuing net inflow of immigrants who give birth at the current rate
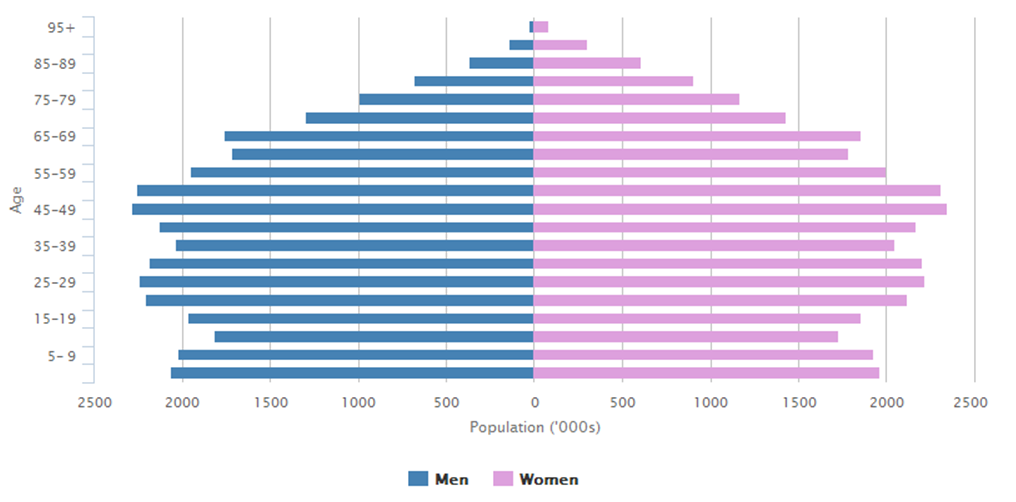
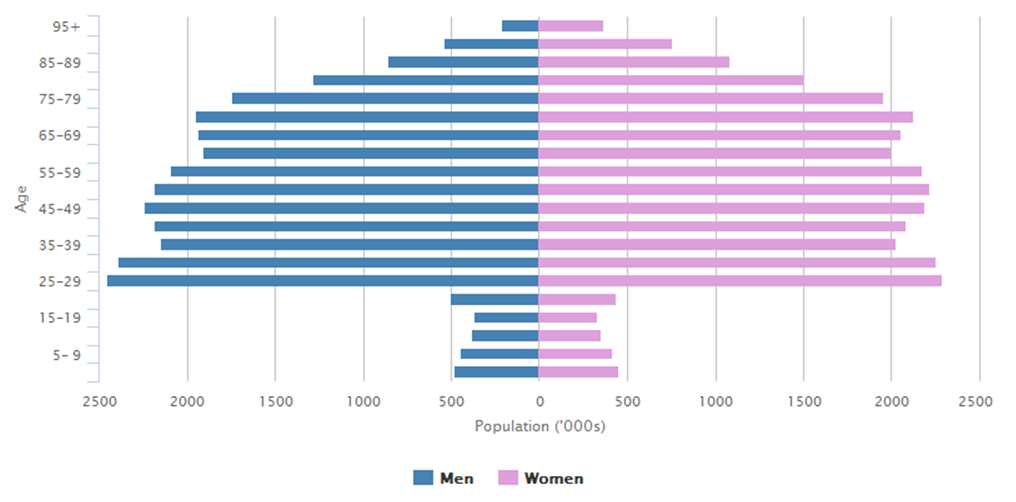
Figure 3. Population of the United Kingdom, 2015; and Figure 4. Projected population of the United Kingdom, 2040
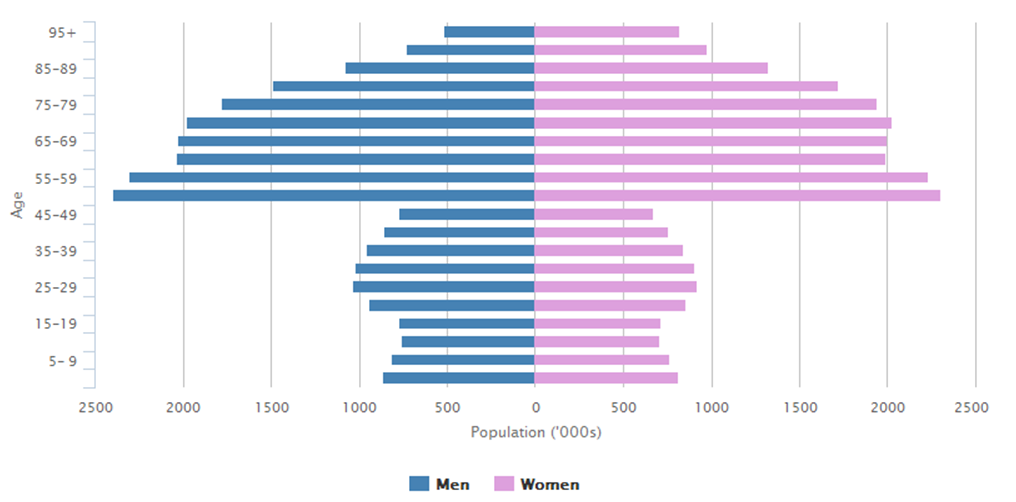
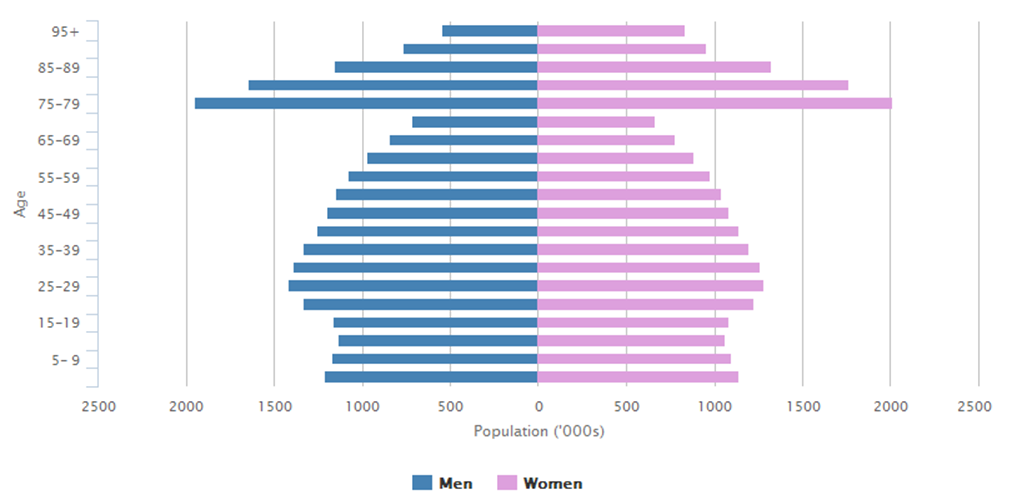
Figure 5. Projected population of the United Kingdom, 2065; and Figure 6. Projected population of the United Kingdom, 2090
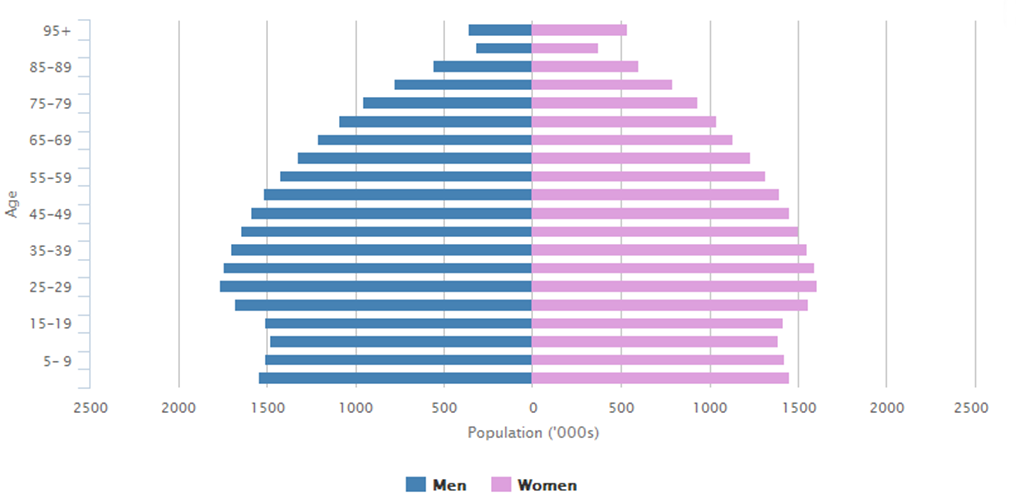
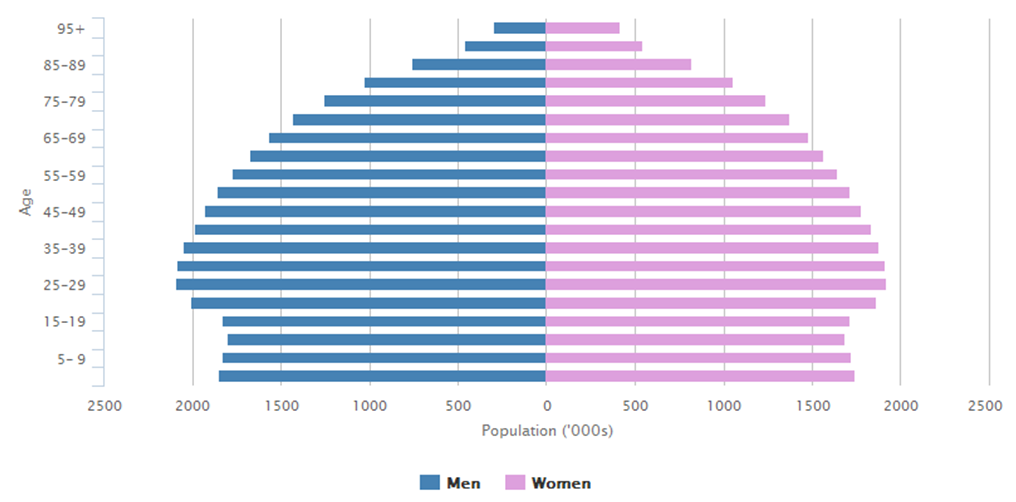
Figure 7. Projected population of the United Kingdom, 2115; and Figure 8. Projected population of the United Kingdom, 2140
The population pyramids for 2015 and 2140 have a similar shape despite the fact that the population grows during this period. Because the birth, mortality and migration rates of the population in this scenario are all unchanging, by the 2130s it has settled down to an unchanging age distribution. Nevertheless, it continues to grow. Demographers call such populations ‘stable populations’. The special case of a stable population with a growth rate of zero is termed a ‘stationary population’. In this case, the UK population stabilises with a growth rate of 0.76% a year.
This growth rate will remain 0.76% for as long as the population’s birth, mortality and migration rates remain the same. The maths of this was worked out by Alfred Lotka between 1907 and 1939. He proved that any population with fixed vital rates converges to a stable age distribution over the course of about four generations and that this distribution is unaffected by the initial age distribution of the population and determined solely by its vital rates. In other words, populations forget their past.
Given that, in this scenario, the UK population has stabilised by 2140, one can use the standard formula for exponential growth to calculate how much longer it will take to increase to 65.1 million again:
where r is the annual growth rate and t is time in years. Therefore:
The population will reach 65.1 million again early in 2148.
One thing that this exercise demonstrates is that migration can have a considerable impact on long-term trends in the size of national populations. As children have two parents, a mean family size of 1.89 children is below replacement-level fertility.
So what will happen if the currently resident population continues to have babies at this rate, instead of stopping childbearing? Well, if immigration ceased immediately, the population would start to shrink in about 10 years time and drop to about 46 million by the end of the century. Yet if, as ONS’s principal projections assume, this level of fertility is combined with a net inflow of migrants in the long term of less than 0.3% of the existing population each year, the population will end up about twice this size by the same date.
- An edited version of this article appears in the April 2016 print edition of Significance. Subscribe now, or join the Royal Statistical Society or the American Statistical Association to receive your copy.
What is 'Ask a statistician'?
A new regular column appearing in print and online in which we invite statisticians to answer burning questions put to them by members of the public. In the next issue, we ask:
World Health Organization experts say “a causal relationship between Zika infection during pregnancy and microcephaly is strongly suspected, though not yet scientifically proven”. How might scientists prove such a link?
- Have an answer? Send it to significance@rss.org.uk, with the subject line “A statistician responds”.
- Have a question? Send it to significance@rss.org.uk, with the subject line “Ask a statistician”.


