
Sumit Rahman replies: First, let’s simplify the problem by talking about the four seasons of the year, and imagining that each season is equally represented among people’s birthdays. Now, suppose we throw a party with exactly six guests. What is the probability that all four seasons are represented by the birthdays of our guests?
We’ll start with what I call a datelist: the birth-seasons of guests in the order they arrive. Two possible datelists are [spring, winter, winter, spring, summer, spring] and [spring, spring, spring, winter, winter, summer]. In total, there are 4x4x4x4x4x4 = 46 = 4096 equally likely different datelists of length 6 (four choices of season in each of the six guest slots).
In the two example datelists above, however, none of our guests have autumn as a birth-season. In other possible variations, spring, summer and winter may also be excluded. We therefore need to count how many possible datelists exclude at least one season, and subtract this from our total – 4096. What’s left is the number of datelists that cover all four seasons.
We’ll call the set of datelists with no winters A, and use B, C and D for the sets of datelists that exclude spring, summer and autumn respectively.
How big is set A? The datelists in this set use only three seasons, so there are 36 of them. Similarly, B, C and D have 36 datelists. You might think that we could simply multiply 36 by 4 in order to work out the number of datelists where at least one season is excluded, but it is not that easy. A datelist like [summer, summer, summer, summer, autumn, autumn] appears in set A and in set B, so we’ll end up double-counting this particular datelist.
Here’s what we have to do instead: Write AB for the set of datelists excluding winter and spring. The basic (but vitally important) inclusion-exclusion principle helps us here: add together the sizes of sets A, B etc; then subtract the sizes of sets AB, AC, BC etc. (There are 6 of these sets, all the same size.) However, summing AB, AC etc. in this way means we double-count those datelists that exclude three seasons (for example, [summer, summer, summer, summer, summer, summer]. So we add in the sizes of ABC, ABD, ACD and BCD, which is 4 lots of the size of ABC. Note, we are adding here because we are subtracting this from a subtraction.
The size of set A is 36. With just two choices in each slot, the size of AB is 26. ABC consists of a single datelist (six autumns), so the size of ABC is 1, which is 16. The number of datelists to subtract from 4096 is 4x36 – 6x26 + 4x16 = 2536, and so the probability that our six guests cover all four birth-seasons is (4096-2536)/4096 = 38%.
We don’t have space here to explain how to calculate those numbers in bold (4, 6 and 4), but there is a simple formula for them (see Pascal’s Triangle).
So, back to the problem at hand: how many people do we need for there to be a 50% chance that every possible birthday is represented by at least one person?
Ignoring 29 February and considering 365 days and a party with n guests (and using the aforementioned formula to work out the coefficients in bold), we calculate 365n – 365x364n + 66430x363n – … and so on. In practice this is not totally straightforward for this example because the numbers become huge – you wouldn’t be able to plug them into a normal spreadsheet.
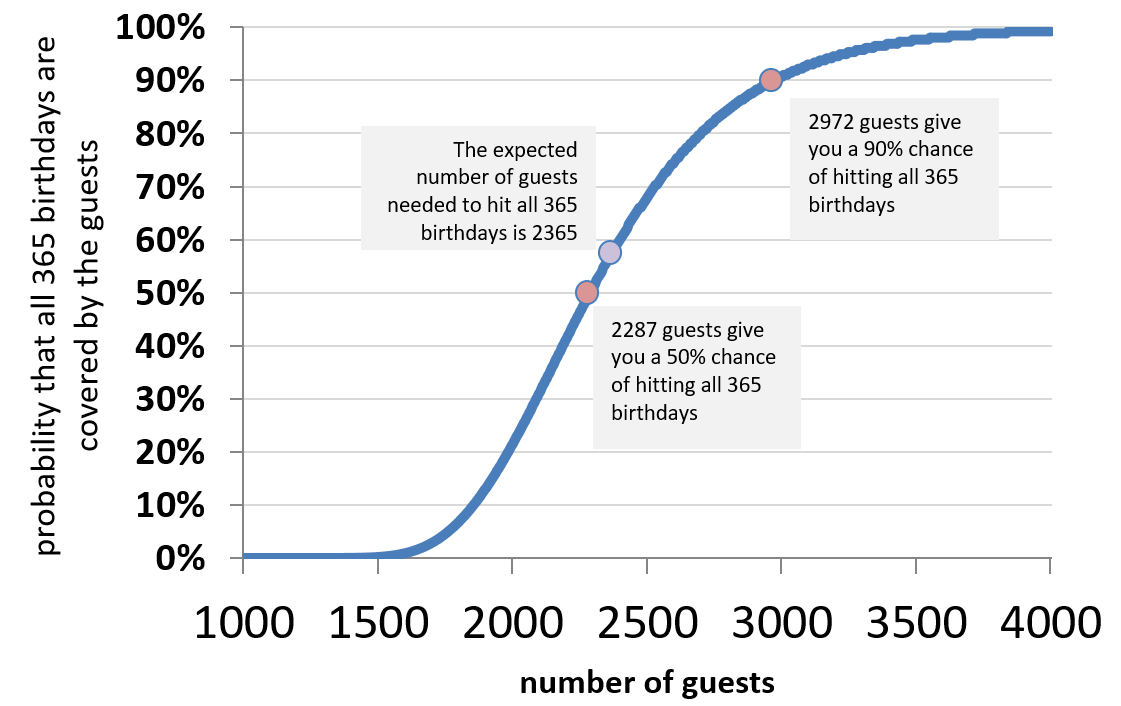
The graph below shows how the probability increases with the size of party. For a 50% probability of all birthdays being taken we need 2287 guests; for a 90% probability we need 2972. To answer a related birthday question – What is the expected number of guests who need to arrive at your party before you tick off all possible birthdays? – we need a much simpler calculation. Simply ask yourself (365 times), ‘How long do I expect to wait before the next guest comes along with a new birthday?’ The answer is 365x(1/365 + 1/364 + 1/363 + … + 1/1) = 2365. Not too different from 2287, and a quick way of getting a reasonably good estimate in a couple of minutes using a spreadsheet.
|
Different question, same solutions The first calculation described in this article can be used to answer similar questions. For instance, to have a 50% and 90% chance of acquiring all 680 stickers for the Panini Euro 2016 sticker album, one would need to buy 4684 and 5962 stickers, respectively. As for the expected number of sticker packs you would need to buy, mathematics professor Paul Harper estimates this at 747 packs (with five stickers in each pack). |
- Sumit Rahman is a statistician in the Department for Business, Energy and Industrial Strategy and a member of the UK Government Statistical Service.
- For an alternative solution that reaches a similar conclusion, click here.
- Our next question is: What are the odds of a person becoming a statistician?, as suggested by @BobOHara, via Twitter. Send your answer to significance@rss.org.uk.


