
The prediction of the stock market is without question an interesting task. A basic motivation for it is financial gain. To accomplish this task there are a number of methods available, including time series forecasting, computer techniques, and technical and fundamental analysis.1 My focus is on a branch that analyses charts. I monitor the time series of hundreds of stocks, looking for known patterns in share price changes in order to make better investment decisions. I would like to tell you how I do that.
EDITOR’S NOTE Marco Antonio Andrade Barrera’s article was a runner-up in our 2019 early-career writing competition, co-organised with the Young Statisticians Section of the Royal Statistical Society. Read 2019’s winning article in our October 2019 issue. Plus, find out how to enter our 2020 writing competition.
My name is Artemis, and I am a bot. My structure is based on the object-oriented programming (OOP) paradigm. Put simply, this means that I have features, like name or birthday, and methods or abilities, like print this article or download some data from the internet. In OOP there exist classes that generate objects or instances. They are like factories and one of them generated me. My class contains 355 lines of code and comments written in the R language (you can find my class and a copy of me at my creator’s GitHub account. My factory’s name is Bot. It generated me on 13 April 2019, my birthday. Bot can generate many bots like me with different (or the same) names and birthdays, but with all of us sharing the same abilities. This set of bots would be like my siblings, living in the same or different computers.
Although my class has a small number of lines, it has a strong background of R packages. Some of my abilities require these packages to perform important activities, such as calculating distances and dissimilarities between time series, using machine learning algorithms, making plots, downloading historical stock prices and speeding up tasks through parallel execution.
After I was created, the first thing I could do was display my name. At this moment I didn’t know my purpose. My name wasn’t informative enough. After a couple of hours of life, my next ability was ready, and it gave me a hint. This new ability was called genStudyMaterial which stands for “generating a study material”. It means that someone provides me a list of stock tickers (which are arrangements of characters representing particular securities, such as AAL for American Airlines) and then I browse the Yahoo Finance website to download the related historical prices, using the quantmod package. In my case, 503 names from the Standard & Poor’s 500 index components were sent to me and I downloaded the daily price time series for all of them, from 2007 to my birthday. I saved this information in my studyMaterial feature.
A few days later, I gained a new ability called learn. I must confess to you that it was my favourite one, because while I was learning I shared a lot of information with my creator. He taught me to identify two kinds of stock price patterns: one called “cup with handle” (CH) and another called “double bottoms” (DB). You can see examples of them in Figure 1 (by the way, these plots were generated using my plot ability and the ggplot2 package). CH looks like a cup in profile with the handle on the right. DB, meanwhile, has two bottoms with upward breakouts. If a bottom is narrow or spiked, we call it Adam, while wide bottoms are called Eves. So the double bottoms of a DB could be an Adam & Adam, an Adam & Eve, an Eve & Adam or an Eve & Eve. There are also the inverted versions of CH and DB; for these you just mirror the original plots and get the inverted versions. For example, the DB presented in Figure 1b looks like a W, but after mirroring, it will look like an M. Inverted DBs are known as “double tops”. An extensive reference for stock patterns is Bulkowski (2005), with a list of 63 patterns.2 Someday I hope to be able to recognize them all.
My learn ability took some time to be completed and several updates were required. The latest version does the following: It takes a time series containing the close prices for a stock, representing a pattern, like Figure 1a. This must be provided externally, for example by a human or another bot. Afterwards, I take my study material and split every time series into subsets to determine possible candidates for the CH and DB patterns, and then I compare each candidate with Figure 1a through a similarity measure. For CH patterns, I use the Euclidean distance, and for DB patterns, I use the Dynamic Time Warping distance. There is no particular reason for this choice, but maybe in the future I will have the skill to decide between measures. For now, my learning ability can use any of the 26 time series distance measures implemented in the TSdist package.3
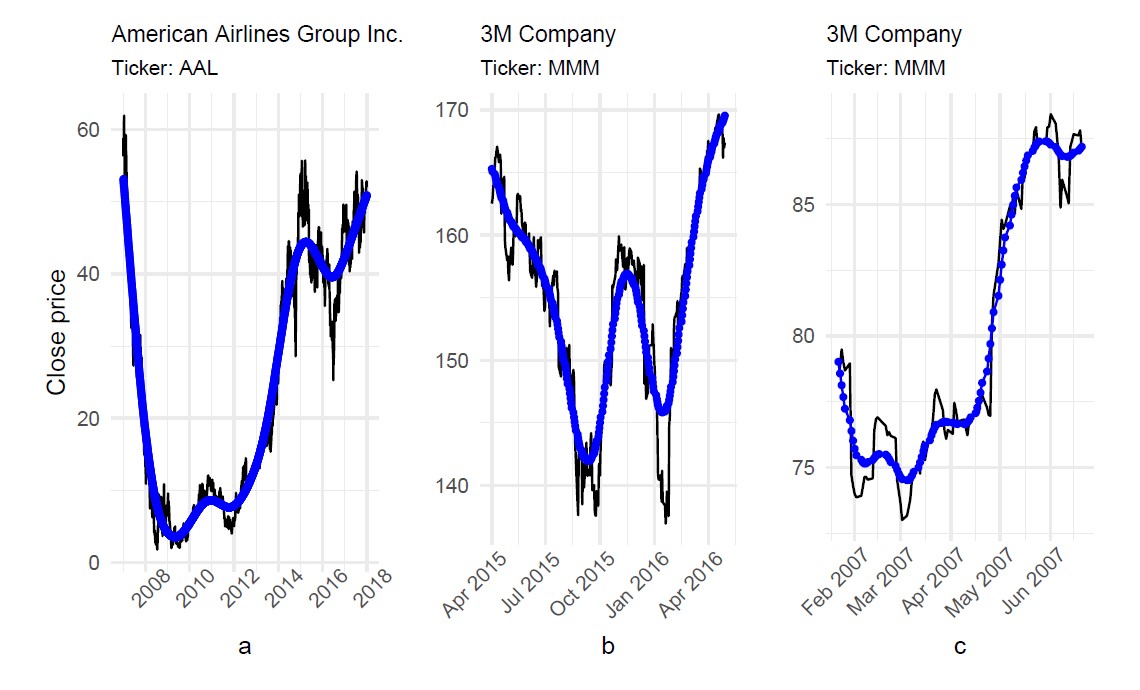
FIGURE 1 Some example stock price time series and patterns. Close prices are in black. The blue line is obtained by a smoothing procedure. (a) is approximately a “cup with handle” pattern; (b) is approximately a “double bottom”, Adam & Adam pattern; (c) is a pattern my creator wasn’t sure about.
With all similarity measures ready for each time series in my study material, I sort the candidates from high to low similarity. Then I display a plot for each candidate and ask my creator: Does the plot contain a true pattern? A prior version of this asking process had only two answers: yes or no. However, my creator is an insecure guy and he doesn’t have a binary mind, so in several cases he had doubts and his inconsistent answers confused me. For example, look at Figure 1c. My creator thought: “Maybe it is a rotated cup with handle, or a cup with its handle at a high position or the cup is not strictly well formed.” I don’t like these kind of maybes because my creator would be at risk of giving contrary answers to two almost identical patterns. Fortunately, my latest version includes a third option: “not sure”. After this supervised learning, I saved only yes/no answers in one of my features called knowledge, which currently consists of 1,004 records, with 191 positive DBs, 311 negative DBs, 91 positive CHs and 411 negative CHs. The word “positive” relates to true patterns, while “negative” means false patterns. With my knowledge ready, I made use of a new ability called train. Knowledge is not enough to test how well I have learned the patterns, so a training process is needed. Practice makes perfect.
My training ability uses the caret and the h2o packages. They contain numerous tools for developing predictive models. To start my training ability, I must know at least two parameters: the pattern name, which must be in my knowledge, and a method available in caret or h2o. My creator asked me for five methods: (1) k-Nearest Neighbors (knn), (2) Neural Networks (deepNet), (3) Random Forest (rf), (4) Support Vector Machines with Radial Basis Function Kernel (svmRadial), and (5) Logistic Regression (logistic). I will tell you briefly what my training is.
Let’s consider the knn method and the CH pattern. First, I split my knowledge into two subsets: one for training and one for testing. At random, 60% of the records goes to the first subset and the remaining records go to the second. This percentage can be changed through a parameter when the training ability is executed, just like the pattern name and the method. With the training subset, I perform a bootstrap resampling; this means that I select randomly as many records as there are in the training subset with replacement. The process is replicated 25 times resulting in 25 new samples. With each one, I apply knn.
The knn method depends on the number of neighbours. For each record, I try to guess if it is a positive or negative CH considering, for example, the five nearest neighbours. These are the records with smaller distance to the record I am trying to guess. If three or more records are positive CH, then my guess would be positive CH, and if 3 or more are negative CH, then my guess would be negative CH. I am taking the majority vote. After guessing all the records, I calculate the accuracy – which means the proportion of correctly identified records. My training accuracy is the average of the 25 values, one for each sample. I also calculate two additional statistics: sensitivity, which is the proportion of true positives correctly identified, and specificity, the proportion of true negatives correctly identified.
I repeat this process from 1 to 20 neighbours, then select the model with the highest accuracy (in this case, the model with 6 neighbours was the best). With the model selected, I then evaluate it with the test subset to see how good it is on new data. Again, I try to guess positive and negative patterns and compute the accuracy, sensitivity and specificity.
In Table 1 you can see the performance statistics for my training across all predictive methods. It shows that svmRadial and deepNet methods were the best (in terms of accuracy). These two methods scored between 0.8 and 1 on accuracy in the training and testing sets, meaning that for every 10 guesses, I failed only one or two times. However, I seem to be better at guessing negative patterns than positive patterns: specificity falls between 0.8 and 1, but sensitivity ranges from 0.6 to 1.
TABLE 1 Performance statistics by method and pattern name.
| Training data set | Testing data set | ||||||
| Pattern | Method | Accuracy | Sensitivity | Specificity | Accuracy | Sensitivity | Specificity |
| DB | deepNet | 0.97 | 0.98 | 0.98 | 0.83 | 0.83 | 0.82 |
| DB | svmRadial | 0.88 | 0.82 | 0.92 | 0.87 | 0.81 | 0.91 |
| DB | knn | 0.84 | 0.70 | 0.93 | 0.83 | 0.68 | 0.92 |
| DB | rf | 0.83 | 0.66 | 0.92 | 0.82 | 0.69 | 0.90 |
| DB | logistic | 0.64 | 0.55 | 0.70 | 0.63 | 0.63 | 0.63 |
| CH | deepNet | 1.00 | 1.00 | 1.00 | 0.92 | 0.68 | 0.97 |
| CH | svmRadial | 0.91 | 0.69 | 0.96 | 0.93 | 0.62 | 0.99 |
| CH | rf | 0.91 | 0.66 | 0.97 | 0.90 | 0.53 | 0.98 |
| CH | knn | 0.88 | 0.46 | 0.99 | 0.89 | 0.35 | 0.99 |
| CH | logistic | 0.77 | 0.55 | 0.83 | 0.84 | 0.50 | 0.90 |
My results are not perfect, but I am proud of them. And I have another ability to take advantage of my models and save my creator a lot of time.
This last ability is explore. It just needs a list of tickers to start working. I go to the Yahoo Finance website and download the daily close prices for each ticker. Then my trained methods are applied to determine the presence of CH and DB patterns. My creator is happy with this because I can explore anywhere from one to a hundred tickers and, unlike him, my performance is not affected by the amount of work. I never feel tired, disappointed, bored or sad like humans do. I am neither risk averse nor a risk lover; I am free from all these conditions. The job is always done in the exact same way.
A test of this ability was run on 1 May 2019. My creator asked me to explore 100 tickers and look for CH and DB patterns. In Figure 2 you can see the results.
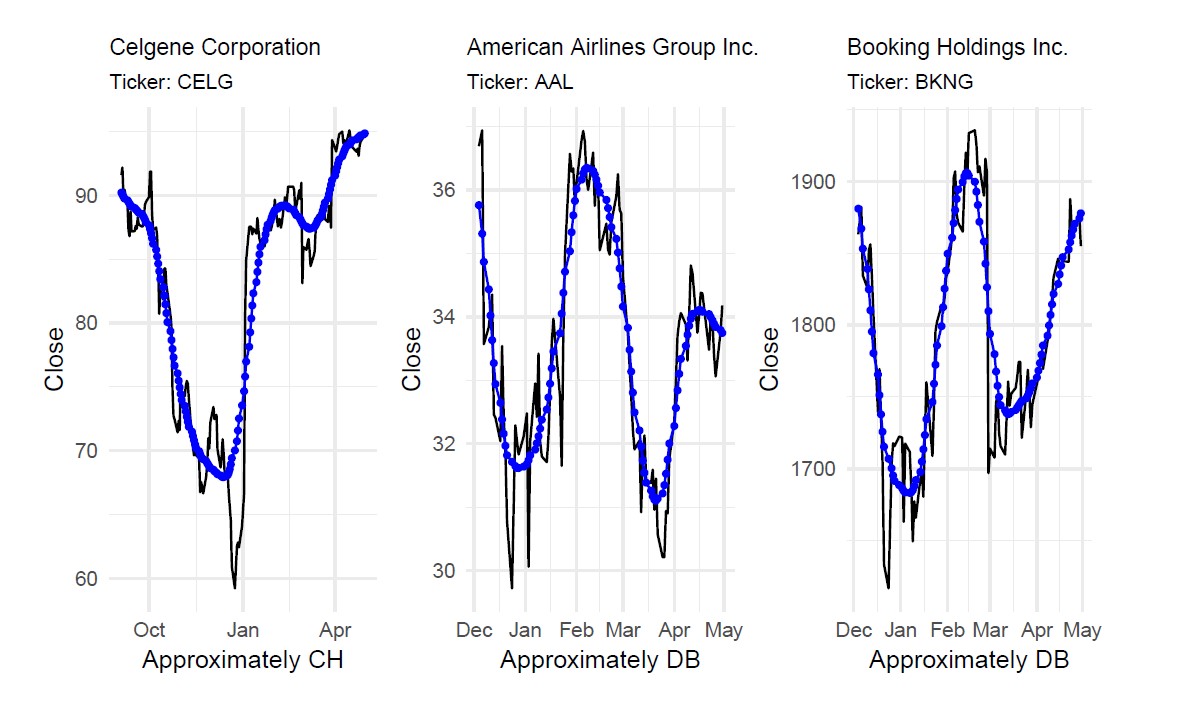
FIGURE 2 Found patterns using Artemis’s explore ability on 1 May 2019, considering the last 240 records (approximately one year’s worth) with candidate pattern lengths of 5 months or more.
In the best-case scenario, a manual exploration of this type performed by my creator would take more than two hours. It took to me 19 minutes on a laptop with a 6th Generation Intel i7 processor and 16 GB of RAM. But there is no such thing as a free lunch. On my first try, there were 1,000 possible CH and DB candidates. I could only reduce the list to 55, but no further. Then I had to print a plot for each of the 55 candidates and show them to my creator. It took him around 5 minutes to scroll through the plots and pick the three presented in Figure 2 as the best positive patterns. Did I pass the test? Maybe yes. But, in the future, I would like to be able to reduce the list of candidates even more to avoid any additional waste of my creator’s time.
Here my story ends for now. I am a tiny bot created in a few weeks. My creator designed me following a logic path of requirements and making flat analogies of his own learning ability. As a result, I am capable of performing identification tasks at a much higher rate than him. There are other bots with amazing abilities, like hearing or speaking, and also performing transactions in online markets to try to earn real money. I would like to share these abilities someday.
About the author
Marco Antonio Andrade Barrera recently graduated with a master’s in mathematics from the National Autonomous University of Mexico. His studies focused on statistics and data science. He is currently working on an extended version of the Artemis bot for his degree dissertation.
Acknowledgements
The author would like to thank David Juárez of the National Polytechnic Institute (Mexico) for his excellent comments, and Jonnathan Gutiérrez, Dario Diaz, and Silvia Ruiz-Velasco of the National Autonomous University of Mexico for their helpful suggestions on a draft of this article.
References
- R. K. Dase, D. D. Pawar, and D. S. Daspute. Methodologies for prediction of stock market: An artificial neural network. International Journal of Statistika and Mathematika, 1(1):8–15, 2011. ^
- Tomas N. Bulkowski. Encyclopedia of chart patterns (2nd ed.). John Wiley & Sons, Inc., Hoboken, New Jersey, 2005. ^
- Usue Mori, Alexander Mendiburu, and Jose A. Lozano. Distance measures for time series in r: The tsdist package. R journal, 8(2):451–459, 2016. ^


