
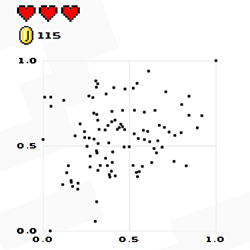
Developed by Omar Wagih, a PhD student studying bioinformatics at the University of Cambridge and the European Bioinformatics Institute, this web-based game presents randomly-generated scatter plots and asks the player to guess the value of the positive correlation between two depicted variables, X and Y: that is, the extent to which there is a relationship between them, such that if one increases so does, on average, the other.
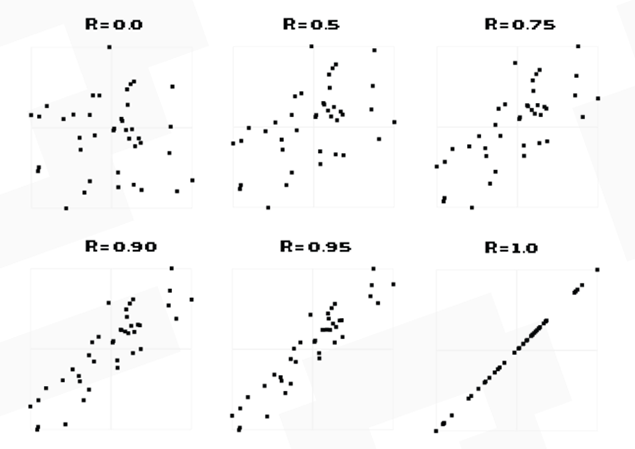
Specifically, the game asks players to assess the strength of the association between X and Y using Pearson’s correlation coefficient (r), with values ranging from 0 (no correlation) to 1 (perfect positive correlation). Of course, with real data it is possible for pairs of variables to be negatively correlated (measured from -1 to 0), so that an increase in one variable is related to a decrease in the other but the game doesn’t consider this case. Examples of positive correlations are shown below.
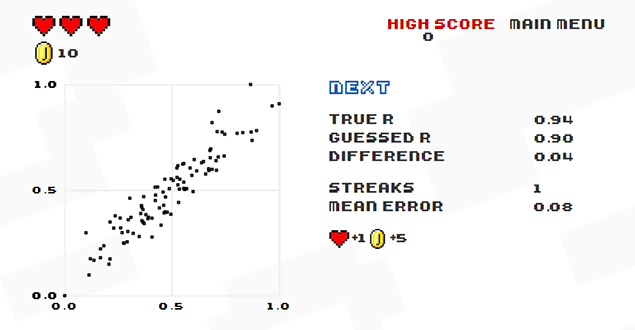
From the player’s perspective, the point of the game is to rack up ever bigger high scores, with coins and lives awarded for accurate guesses, and lives deducted if estimates are wide of the mark.
But the game has a deeper purpose for its developer. Each time a guess is made, Wagih’s system stores the date, time and IP address of the player as well as details of the guess itself – all of which will be analysed with the aim of understanding how people perceive correlations within scatter plots and whether there are specific visual elements that can mislead us.
Significance: How did the idea for the game come about?
Omar Wagih: The idea came during a seminar talk late last year, in which the presenter showed a scatter plot and claimed that the variables were correlated without giving an r value. I was doubtful of this as I knew that scatter plots can often demonstrate what seem to be improbable correlations. This can often be attributed to small factors, such as outliers or the proportion of points in each of the four quadrants of the graph, which can affect ones perception.
The next question I asked myself was whether others would share my doubts about the presented scatter plot. It quickly occurred to me that I could put together a small app with randomly generated correlations and ask how others perceived the correlations in those scatter plots.
I knew that people wouldn’t spend much time guessing correlations if there was no incentive, so I decided to build a game around it. I later added a scoreboard to introduce some competition, and a two-player mode so people could challenge each other.
Significance: You describe Guess The Correlation as “a game with a purpose”. Could you explain more about that purpose?
Omar Wagih: The game serves two main purposes. First and foremost, it is an educational tool for students studying introductory statistics. Grasping concepts like correlation can often be challenging for students. The game provides a fun and entertaining way to develop knowledge of the concept.
The second purpose of the game is to act as a behavioural study on how players perceive correlations in scatter plots, which is a field actively pursued in behavioural psychology (see here and here).
Significance: You’ve amassed 2 million guesses (as of 1 February 2016) from 100,000 participants. What will you do with all the collected data? What questions do you hope to answer?
Omar Wagih: I’d like a better understanding of two things. First, what are the properties of scatter plots which have an impact on the error rates in correlation guesses? The idea here would be to identify features within scatterplots that dictate poor or good guesses. A very obvious example is outliers. According to Bobko et al., outliers are often overlooked, resulting in underestimation of the true correlation. People are often unaware how as little as one or two outliers can drive the overall correlation. Another example is variability among the two variables. Scatter plots with a fair amount of variation, despite being correlated, can lead someone to underestimate the true correlation. This is because variation is typically associated with low correlations.
Second, I want to see whether intuition of correlations in scatter plots improves over time by playing the game. If it does, the game serves as much more than just entertainment, it could be used as a training tool. As researchers, we have a responsibility to be diligent when reporting results and I believe these sorts of games will help improve that.
There are several challenges associated with analysing the data, however. Many variables aren’t controlled for, such as the demographics of players. I’ll also likely need a fair amount of quality control to eliminate players that may be entering spurious data. I plan on improving upon the game to tackle these issues in the near future, but I am confident that the data I’ve collected so far will show some insightful trends.
- Guess The Correlation is online at guessthecorrelation.com


