
Women’s football has rocketed in popularity, in terms of audience and players. But should the men’s and women’s games have distinct statistical models?
Women and men football: different data?
Bend it like Beckham was a 2002 movie directed by Gurinder Chadha about an 18-year-old British Indian girl living in West London, passionate about football – and especially about her idol, David Beckham. It was perhaps the first film to bring women’s football to a wide audience, featuring a very young Keira Knightley as the protagonist’s best friend. Since then, women’s football has grown dramatically in visibility and popularity.
In the most recent Women’s World Cup, held in Australia and New Zealand in 2023, the average attendance per match reached around 30,911 spectators, while stadium occupancy (capacity use) averaged 85% across all venues for the entire tournament. The final, between Spain and England at Stadium Australia in Sydney, drew a crowd of 75,784. Similarly, at the European Women’s Championship 2022, 87,192 spectators filled Wembley Stadium to watch England’s victory over Germany.
A 2023 FIFA survey reported that the number of women and girls playing organised football had risen by nearly a quarter compared to 2019, reaching 16.6 million within its member associations. Looking ahead, a report by Nielsen Sports and PepsiCo projects that the global women’s football fan base will grow by 38% – from roughly 500 million to more than 800 million by 2030. In Europe, there was a huge growth in female players: France (+150%), Spain (+95%), the Netherlands (+25%), and the UK (+24%) have all recorded major increases since 2019.
At the same time, research on football analytics has expanded rapidly, fuelled by new data sources such as player- and ball-tracking systems, which have transformed both data availability and analytical possibilities. A detailed overview of statistical models for football can be found in our newly published book Predictive Modelling for Football Analytics (CRC Press).1
All this raises a natural question: how similar – or different – are the men’s and women’s games, statistically speaking? Are the models developed for men still suitable for women’s football, or should we design new ones that better reflect the dynamics of the women’s game? Some work has already addressed this issue. For example, researchers have compared several event-related characteristics between men’s and women’s football2, while others have discussed models for European women’s championships, focusing on how certain features differ across competitions3.
Our goal here is to take a closer look at the top-5 European championships and make a quick comparison between men and women in two areas. The first, naturally, concerns the main objective of the game: scoring goals. There is a rich literature on whether Poisson-based models adequately describe goal counts and their correlation within a match. Typically, overdispersion is observed – that is, the variance of goals exceeds the mean. We ask whether this phenomenon behaves similarly for men and women, or whether differences in playing style and competition dynamics lead to distinct goal-scoring patterns.
In a similar vein, we examine a less studied aspect of the game: disciplinary sanctions. Specifically, we consider the number of cards awarded per match.
Do these patterns look the same across genders – or do they tell a different story?
The data: the top-5 European championships
Data is taken from fbref.com. It covers the top-5 European championships for both men and women. In particular, we use data from the English Premier League, German Bundesliga, French Ligue 1, Spanish La Liga, and Italian Serie A – for both sexes. Note that, for women, the official tournament names differ slightly: Frauen Bundesliga in Germany and Première Ligue in France. All results refer to the 2024–2025 season.
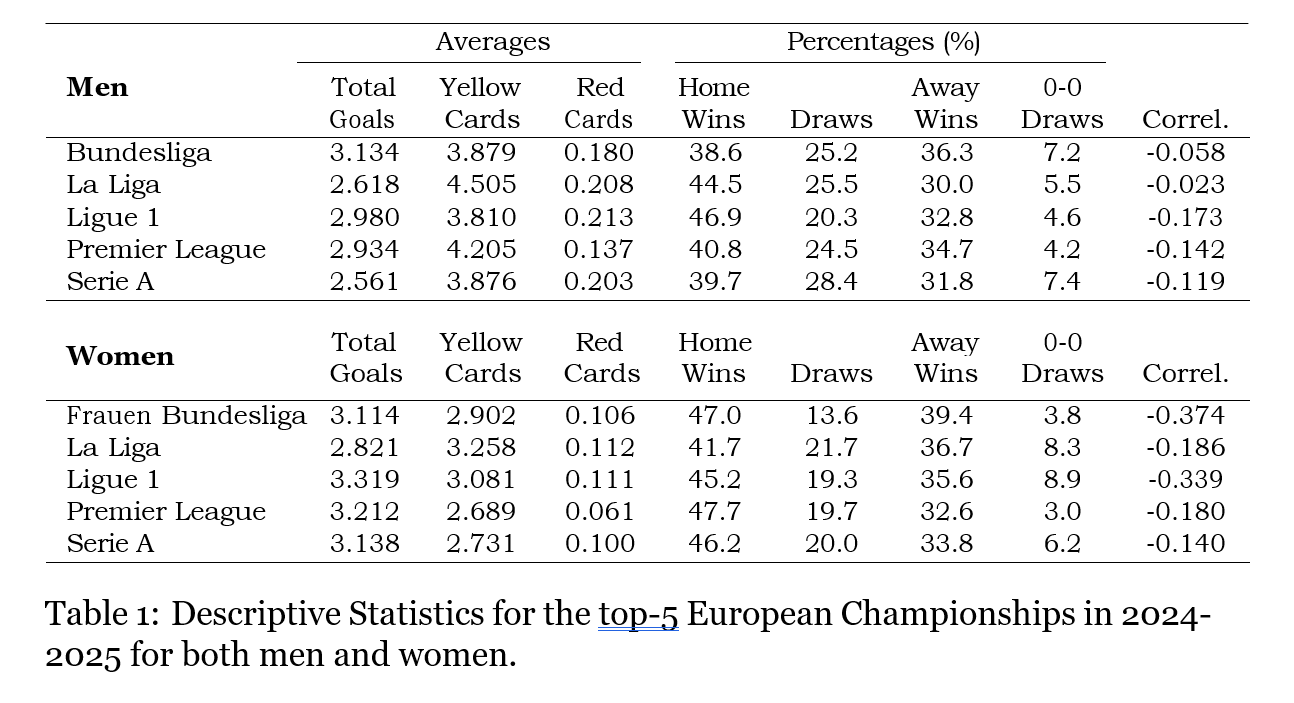
We focus on two key characteristics: the number of goals and the number of cards. Table 1 reports, separately for men and women, some basic statistics on goals scored, yellow and red cards, the observed proportions of home wins, draws and away wins, the proportion of 0–0 scores and, finally, the Pearson correlation between the numbers of goals scored by the two teams.
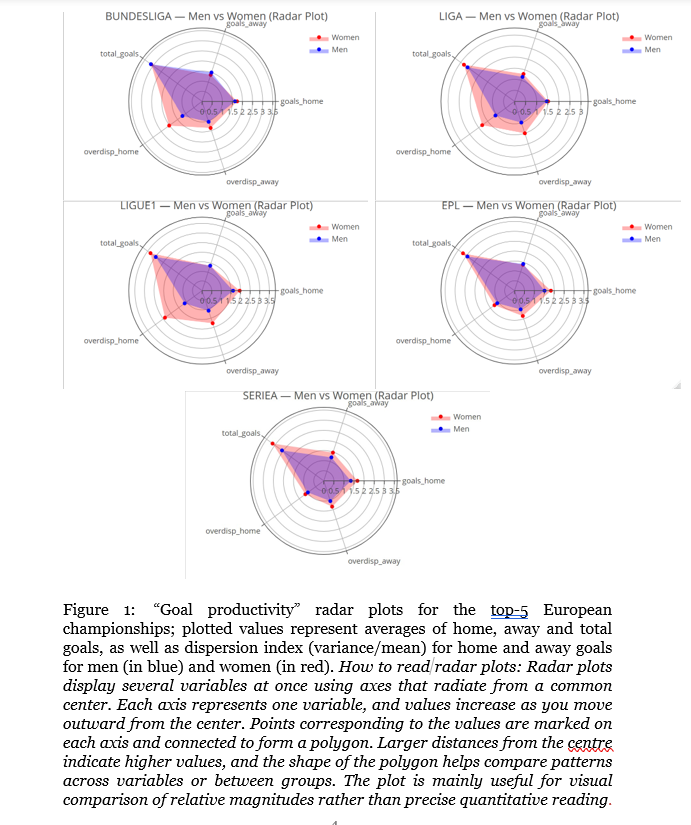
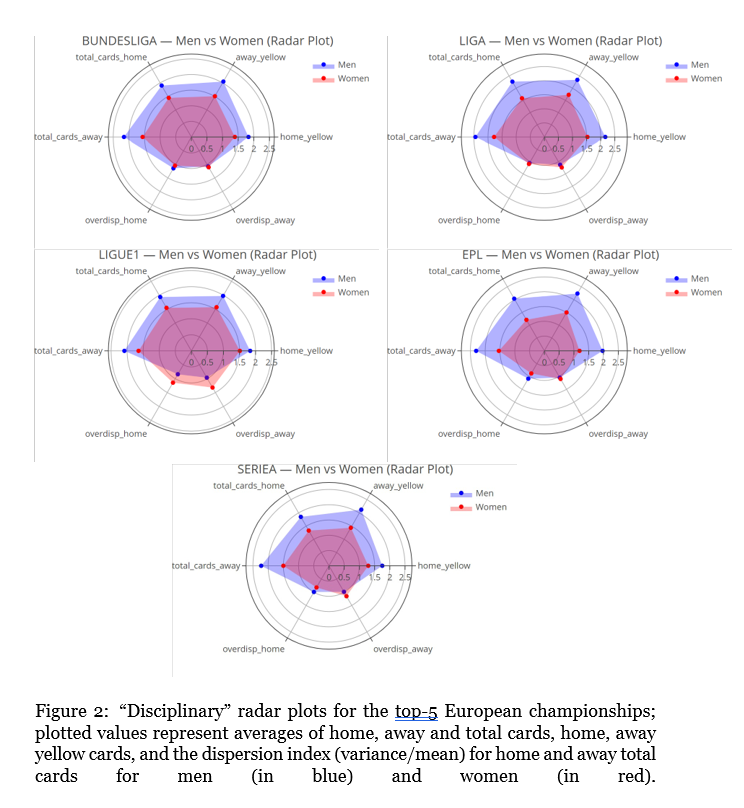
Table 1 and the radar plots in Figures 1 and 2 – where we further disaggregate for goals and cards – tell an interesting story. When it comes to scoring, women tend to find the net more often – except in the Bundesliga (Germany), where men lead slightly. The pattern reverses for disciplinary sanctions: men receive substantially more yellow and red cards per game. For yellow cards, the difference is roughly 30%, suggesting a different playing style, perhaps faster and more physical. An additional factor may also play a role: women’s championships feature a greater number of female referees, which could influence how cards are awarded.
The well-known home advantage shows mixed effects. In some countries, home wins are more frequent, but in others the difference is less marked. Draws, on the other hand, are less common across the board – a pattern consistent with the generally higher number of goals scored in women’s matches. The frequency of 0–0 results also varies notably between genders, with no uniform trend across countries.
Looking at goal differences, we find that – apart from Spain – women’s championships tend to exhibit larger score gaps, sometimes by a wide margin. This could reflect variations in the balance of competition, that is, how evenly matched the teams are.
Another striking result concerns the Pearson correlation between the goals scored by each team: for women, this correlation is much stronger (and negative). In fact, its magnitude can be so high that some standard statistical models become less applicable.
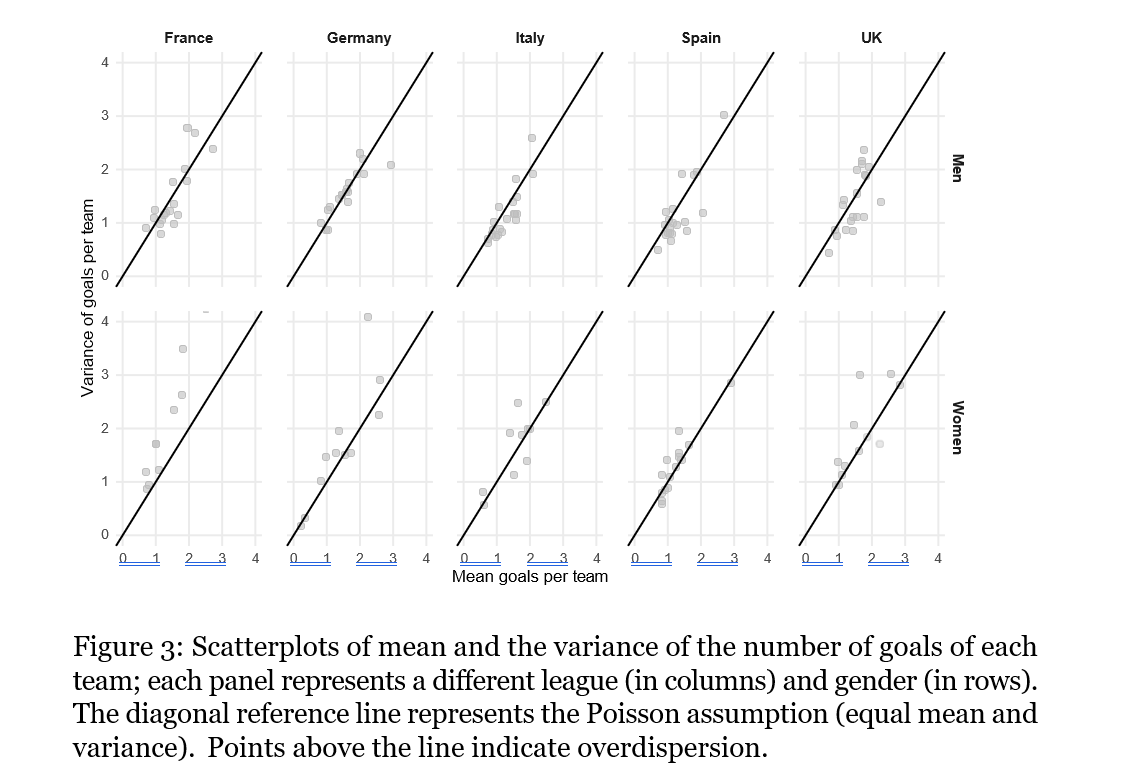
Figure 3 illustrates the relationship between goals’ mean and variance at the team level for all five championships, for men and women, respectively. Under a Poisson model, teams should fall roughly along the diagonal line, since for a Poisson distribution the mean equals the variance. A negative binomial model, by contrast, allows for overdispersion – where the variance exceeds the mean – and is often used as an alternative, In the next section we will depict model implementation using both the alternatives. In Figure 3, the men’s data aligns closely with the diagonal, suggesting that equidispersion might be a reasonable assumption. By contrast, the bottom panel shows a clear shift upward: more teams lie above the diagonal, indicating consistent overdispersion in women’s football.
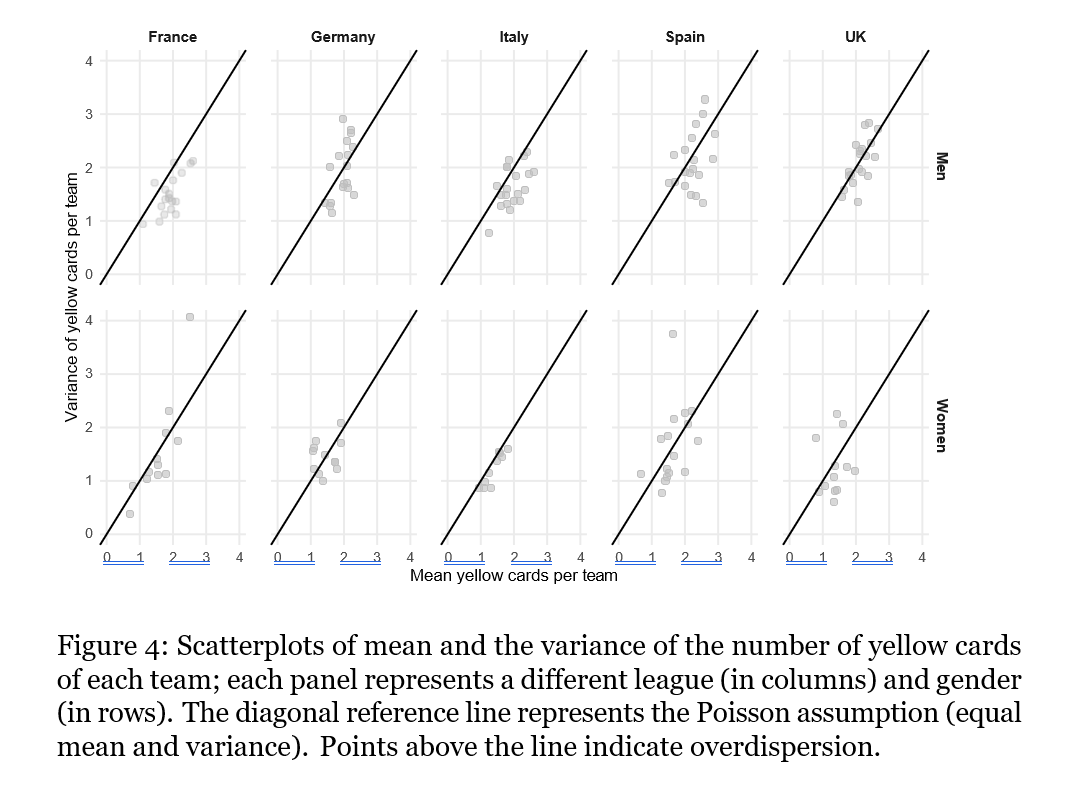
As far as the number of cards is concerned, Figure 4 shows, for each team, the mean and variance of yellow cards, for both men and women. Several studies have attempted to model the number of cards using the Poisson distribution (see, e.g., Dawson et al.,6 who used a slightly different definition of disciplinary points). If this assumption is true, then the mean should be equal to the variance. Across championships, we generally find a reasonable agreement with the Poisson assumption. As already discussed, men tend to receive more yellow cards overall. Interestingly, for men in France and women in Italy, most values lie below the diagonal line, indicating underdispersion – that is, less variability than would be expected under a Poisson process.
Taken together, this descriptive analysis highlights several differences between men’s and women’s football. These patterns suggest that models developed for men may not always fit women’s data equally well, and that new or adapted approaches could provide a better description of the women’s game. But what happens if we go a step further and estimate a model separately for each championship?
Model estimation and comparisons
The Poisson assumption for goal counts appears to be broadly adequate based on our preliminary analysis. We then fit a ‘vanilla’ double-Poisson (DP) model1 for the match scores4 across the top-5 European championships in 2024–2025 by using the footBayes R package5.
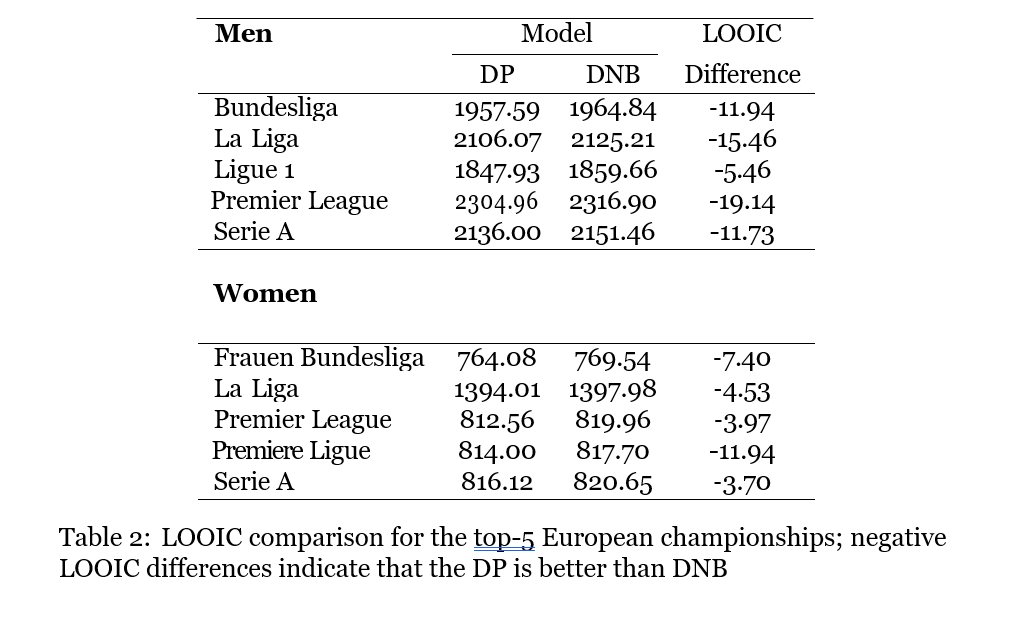
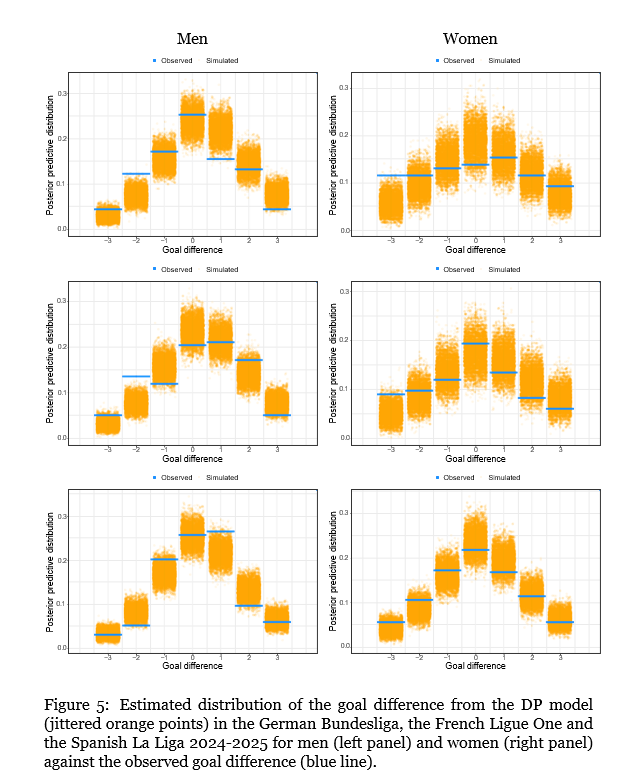
Figure 5 presents the Monte-Carlo estimated distribution of goal differences from the DP model (orange jittered points) compared with the observed goal differences (blue lines) for the 2024–2025 season in the German Bundesliga, the French Ligue 1, and the Spanish La Liga. For simplicity, the plot is truncated at goal differences of ±3. Results are shown separately for men (left panels) and women (right panels). From Figure 5, we observe that the draws (goal difference equal to zero) are well captured by the DP model for both men and women. However, unlike for what happens for men’s data, the DP model captures very well any other occurrence for women’s data. This pattern reinforces the notion that men’s and women’s competitions exhibit different shapes and perhaps may require distinct statistical models.
To enlarge the comparison, we also fitted a double negative binomial (DNB) model for the scores and we computed the leave-one-out cross-validation information criterion (LOOIC)7, a sort of Bayesian version of the AIC. Table 2 depicts the LOOIC for the double Poisson and the double negative binomial model on the top-5 European championships, for men and women in the 2024-2025 season: as it is evident, the DNB model does not improve over the DP model in any championship. Perhaps, goals’ overdispersion seems not so relevant here, as already anticipated by Figure 3: model estimation revealed that the vanilla DP model is a solid standard in the football analytics, for both the sexes.
Conclusions
As noted in this short analysis, there are some differences between men’s and women’s professional football, particularly in terms of scoring and disciplinary actions. However, these differences do not appear to be as pronounced as in sports such as basketball or volleyball, where the greater physical power in the men’s game plays a much larger role, leading to substantially different statistics and, potentially, modelling approaches. We stress that our analysis is limited to the European teams, however men’s and women’s football are highly popular in other parts of the world, such as Latin America, USA, and Asia. Moreover, it seems that the geographical locations of the top national women’s teams are rather different from men’s football teams, as for Sweden, USA, and Japan. As far as we know, top women’s national teams like the USA, Sweden, and Japan excel due to strong youth development, widespread participation, and stable, well-structured programs. The USA benefits from college sports, Sweden from inclusive grassroots systems, and Japan from coordinated technical training.
With respect to model estimation, the double Poisson model represents a well-known standard for modelling the scores and is never dominated by the double negative binomial – see the LOOIC comparison at the end of the previous section.
To reveal systematic differences between men’s and women’s data, future investigations could focus on goals correlation through the use of bivariate distributions and copula models.
Until that moment, we will declaim: “Poisson, and only Poisson: this is not a question”.
References
1. Egidi, L., Karlis, D., and Ntzoufras, I. (2025a). Predictive Modelling for Football Analytics. CRC Press.
2. Pappalardo, L., Rossi, A., Natilli, M., and Cintia, P. (2021). Explaining the difference between men’s and women’s football. PLoS One, 16(8):e0255407.
3. Michels, R., Oetting, M., and Karlis, D. (2025). Extending the Dixon and Coles model: an application to women’s football data. Journal of the Royal Statistical Society Series C: Applied Statistics, 74(1):167–186.
4. Karlis, D. and Ntzoufras, I. (2003). Analysis of sports data by using bivariate Poisson models. Journal of the Royal Statistical Society: Series D (The Statistician), 52(3):381–393.
5. Egidi, L., Macrì Demartino, R., and Palaskas., V. (2025b). footBayes: Fitting Bayesian and MLE Football Models. R package version 2.0.0.
6. Dawson, P., Dobson, S., Goddard, J., and Wilson, J. (2007). Are football referees really biased and inconsistent?: Evidence on the incidence of disciplinary sanction in the English Premier League. Journal of the Royal Statistical Society Series A: Statistics in Society, 170(1):231–250.
7. Vehtari, A., Gelman, A., and Gabry, J. (2017). Practical Bayesian model evaluation using leave-one-out cross-validation and WAIC. Statistics and computing, 27(5):1413–1432.
Predictive Modelling for Football Analytics by Leonardo Egidi, Dimitris Karlis and Ioannis Ntzoufras (CRC Press) is available now.

Leonardo Egidi is an associate professor of statistics at the Department of Economics, Business, Mathematics, and Statistics “Bruno de Finetti”, University of Trieste, Italy.
Dimitris Karlis is a professor in the Department of Statistics, Athens University of Economics and Business, Greece.
Ioannis Ntzoufras is a professor in the Department of Statistics, Athens University of Economics and Business, Greece.
You might also like: Home advantage: What’s changed since Covid?
Which Premier League team has the most impactful fans?


