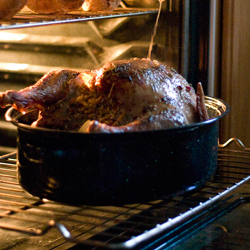
Last year Jarad Niemi told us that the expected US production of turkeys in 2010 was 242 million and gave us some other Thanksgiving statistics. This year, the USDA National Agricultural Statistics Service expects a similar amount of turkeys, 248 million, will be raised. In 2009, Americans ate 13.3 pounds of turkey per person in mean. But this is a mean… and you should be wary when interpreting means. An average is often of little help if it is not supplemented with information about the underlying distribution of the data. Note that you might eat more or less depending on your wealth and food habits. You wouldn’t expect a vegetarian to eat any turkey at all! And according to two polls made for the Vegetarian Resource Group in the years 2009 and 2010, 7% of American youth and 8% of adults never eat meat. Whereas poor people might not be able to get so much turkey. According to the US Census Bureau 15% of American households (17.4 million households) have problems to find acceptable foods, and about a third of them (6.8 million households) have real problems. What’s more, in 2009 almost half a million American households (1.2 % of American households) couldn’t even feed their children properly. And if there are people who eat less turkey or no turkey at all, there must be other people who eat more turkey than the average –mind that one third of the American population is obese. None of this information is included in the mean.
A similar story, this time with chicken as the main character, is known in Italian statistical circles as the problem of Trilussa’s chickens, after Carlo Alberti Salustri (1871-1950), alias Trilussa. But, who was he? He was not an Italian statistician. Instead, he was a poet. You may wonder why he is so famous among Italian statisticians then. Well, the reason is that, apart from being one of the best Italian poets, he happens to be the author of a witty sonnet defining what statistics is and the problems of using the mean. Such a deed! It’s not easy to explain statistics clearly in plain language, just imagine in verse! A reference to Trilussa’s poem appears in one of the videos in the Video section (it won the 'Most Entertaining Spaghetti Western' Award in the "Promoting the Practice and Profession of Statistics" video competition) and you can read here the original Italian version and my own translation of the poem:
La statistica Statistics
Sai ched’è la statistica? E’ ‘na cosa Do you know what statistics is? A thing
che serve pe’ fa’ un conto in generale that’s used to record a general tale
de la gente che nasce, che sta male, of the newborn people, those with an ail,
che more, che va in carcere e che spósa. the dead, the imprisoned and those marrying.
Ma pe’ me la statistica curiosa But for me the statistic that is funny
è dove c’entra la percentuale, happens when percentage enters the game,
pe’ via che, lì, la media è sempre eguale so that, then, the mean is always the same
puro co’ la persona bisognosa. even for the person who has no money.
Me spiego: da li conti che se fanno That is, from the calculations you make
seconno la statistica d’adesso in accordance to current statistics
risurta che te tocca un pollo all’anno: one chicken per year you should take:
e, se nun entra ne le spese tue, and, if your budget doesn’t allow you,
t’entra ne la statistica lo stesso nevertheless allows it statistics
perché c’è un antro che ne magna due. because someone other will eat two.
If you are curious about how many chickens are raised in the US, in 2010 172 million chickens were slaughtered –and (you might prefer not to read this before lunch) another 107 million died, were rendered, destroyed, composted or disappeared for some reason. Regarding chicken consumption, it is about four times greater than that of turkey, the mean ingestion of chicken in 2009 being 56.0 pounds per person, or 10 chickens weighing 5.6 pounds. Quite a difference from the early 20th century Italy! And again, there will be people who don’t eat any chicken (either because it is budget or beliefs not to allow it) and other people will eat much more than 10 chickens, be it roasted, fried, as chicken pie, in a salad, or a chicken casserole.
There is such variability in the ways to prepare chicken! Variability is what you aren’t taking into account when you use only the mean to describe your data. It can lead to wrong conclusions and many interesting things remain hidden (how many people eat how much turkey). Plus, different distributions of the data can have similar means: you obtain a mean of one chicken per year whether everyone eats one, or half the population eats none and the other half two, or three quarters eat none and the other quarter eats four. The conclusions will be rather different, though. We could say that using only the mean is like trying to tempt a special guest simply telling him/her “I’m cooking chicken”, disregarding the many ways in which it can be prepared. Is it not much more mouth-watering (and informative) to say: “I’m preparing rich herb and lemon chicken”?


