US polling houses have taken a battering in the last three US elections, with public trust dwindling further with every criticism by Donald Trump. But polling cannot predict the future, and is harder than people think
Once again, the year on the Gregorian calendar is divisible by four. In the 21st century, this means the United States will hold its quadrennial presidential elections.
Lately, this also leads to loud claims of “fake polls” in the United States. Recall that in 2016 one of the two main presidential candidates hoping to be elected in 2024 claimed that polls were fake. This happened again in 2020. William Kristol, chief of staff to vice president Dan Quayle and founder of the neoconservative political magazine The Weekly Standard, suggested the reason for this claim: “Saying the polls are fake helps in laying the predicate for claiming the election is rigged… He [Donald Trump] has a general interest in discrediting the truth, and this is part of an assault on the truth”.
In 2024, that same candidate has once again begun asserting that the polls are fake: “FoxNews will put up Fake Confidential Democrat Polls that were ‘leaked’ to them, but not Rasmussen or any of the REAL polling groups that have me way ahead. What’s up with FOX? I do better with CNN!!!”.
Are some polls fake? Indubitably. However, not all are. Also, even polls that follow the ethical rules of polling as set out by the American Association of Public Opinion Research can come to different conclusions… sometimes surprisingly so. This variability understandably leads the casual consumer of polling news to conclude that polls are not telling the whole truth. From here, it is a short step to concluding that polls are fake.
If we assume that there are ethical pollsters being covered by the media, then it behooves us to ask ourselves how to explain this variability between polls, as well as the fact that some polls tend to systematically estimate a higher support for candidate X than others.
With this background, how should we read and understand the political polls reported in the media?
Why an ethical poll may be wrong
No poll gives the exact answer. Accuracy and precision are two related concepts in statistics that explain why this is. In statistics, we tend to focus on their antonyms: bias and variance. Bias measures how far off the averages are from reality, how inaccurate the polls are. Variance measures the variability between polls and reality, how imprecise the polls are. If a polling firm is 20 points too high half the time and 20 points too low the other half, then there is no bias in their estimates. However, the variance is very high. Conversely, if a polling firm is always 20 points too low, there is no variance in the estimates, but the bias is rather high. Most polls fall between these two extremes in that they contain both bias and variability in their estimates.
Sources of bias
There are several sources of bias in polling. Assuming the polling house is competent and ethical, then the largest source of bias – and the source of a polling house tending to systematically estimate a higher support for candidate X than others – is a mismatch between the sampled population and the target population.
The target population is the group we wish to draw conclusions about. For this article, the target population is the group of people whose votes are counted in the election. Note that this population does not exist until the voting ends.
The sampled population, on the other hand, is the group from which the polling firm draws their sample. This is defined by the methods used by the firm to contact people. If they only call landlines, then the sampled population is all people who answer the telephone who live in a house with a landline. If they call telephones (cellular and landline) but screen by people who claim that they will vote in the upcoming election (a.k.a. likely voters), then the sampled population is all people who answer the telephone who claim they will vote in the election.
Polling houses have their own idea of what the voting population will be. Those houses who think that Republicans will consist of 40% of the voters will tend to estimate Republican support higher than houses that think Republicans will only be 30% of the voters
That the target and the sampled population are different is not a serious issue, in theory, because the vast majority of polling houses will weight their sample according to what they expect the target population will be. That is, if they expect that women will constitute 55% of the actual voters, but their sample contains only 30% female, then they will weight the estimates for women in their sample by multiplying the estimate by 55/30. This ensures women account for 55% of the final estimate, thus mitigating the issue of polls that oversample one demographic or another.
This weighting leads to the primary source of bias in ethical polls. Polling houses have their own idea of what the voting population will be. Those houses who think that Republicans will consist of 40% of the voters will tend to estimate Republican support higher than houses that think Republicans will only be 30% of the voters.
Figure 1 illustrates this for the two polling houses in the 2020 US presidential race in Wisconsin. The crosses represent Marquette Law School Poll results; the solid dots, Change Research results; the open circles, other polling houses. The curves are drawn to show the moving averages of the two sets of estimates (technically: lowess smoothing curves). That the curve for Change Research estimates is entirely above that for Marquette shows that the two polling houses have different ideas about the voting population. Which is correct? There is no way to know because we do not know the target population. All we can say is that, compared to Marquette Law School, Change Research assumes a higher Republican turnout.
Variability
After deciding on the questions to ask, polling houses contact a random sample from the sampled population. Since the sample is random, any measurement on it is random. Thus, three polling houses following the exact same protocol will have three different estimates for candidate support, even if they assume the exact same characteristics of the voting population. This is the primary source of variability between estimates from a given polling house.
The “solution” to the issue of variability is to collect a larger sample. Estimates will become less variable at a rate of n1/2, where n is the sample size. Thus, doubling precision requires quadrupling the sample size. Since collecting good data is expensive, there are few polls with sample sizes in excess of 2000 unless they are online polls.
Interestingly enough, Figure 1 cannot be used to illustrate polling variability because we never know the true support for Trump in the voting population. To see this, assume that population support is always 2 percentage points greater than what Change Research estimates.
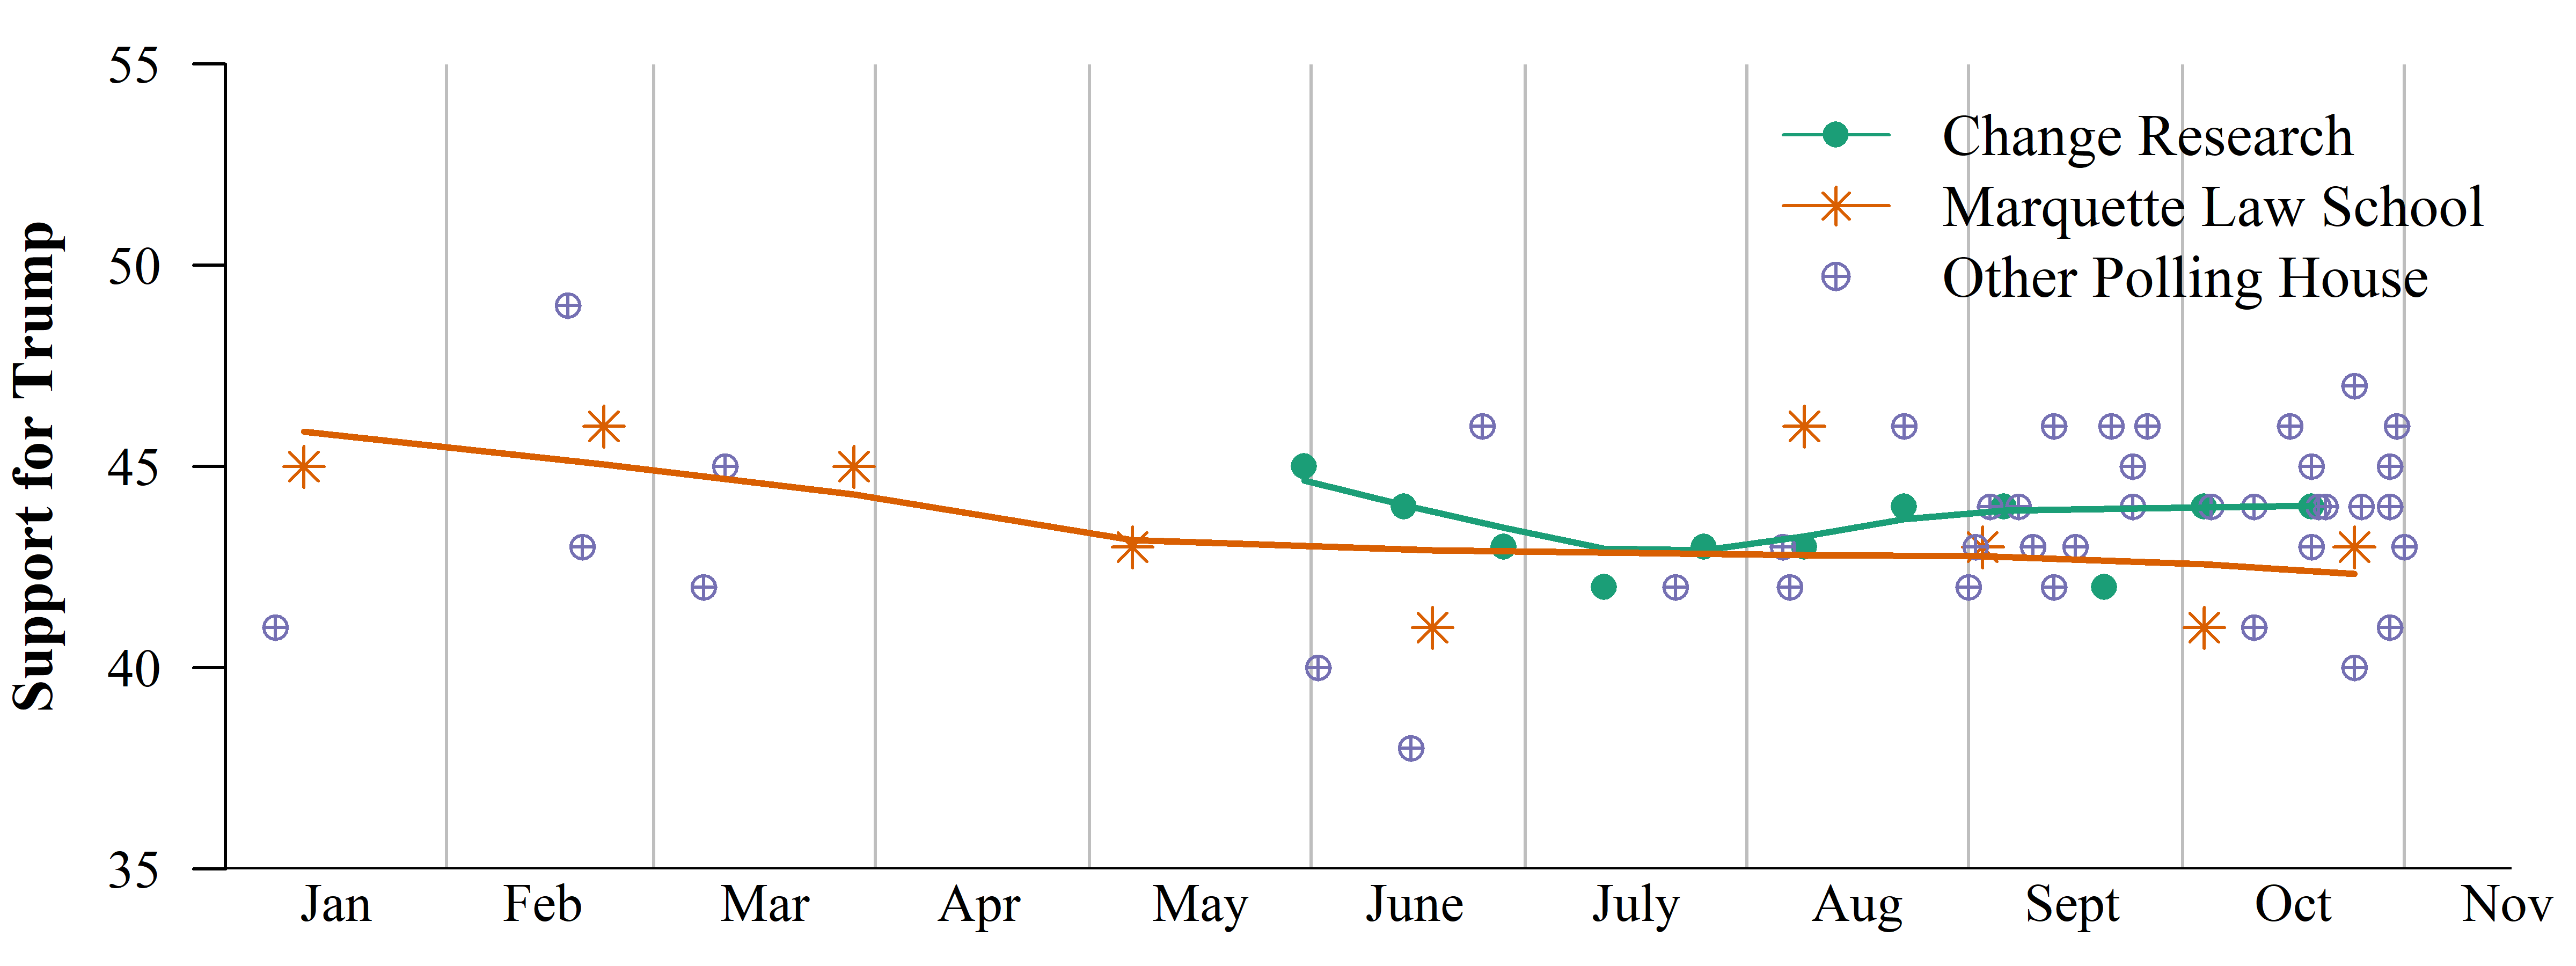
Figure 1: Scatter plot of polling estimates of Trump support in Wisconsin during 2020. Crosses indicate Marquette Law School Poll estimates; the solid dots, Change Research; the open circles, other polling houses. The two lowess curves estimate the moving averages of the two sets of estimates.
Measuring poll quality
This discussion of bias and variance, of accuracy and precision, leads us to the most important question of all: Which polls should I pay attention to? The quality of a poll entirely resides in the reputation of the polling house, and this comes from its level of transparency. Being open about their procedures and assumptions is a cornerstone of the American Association for Public Opinion Research (AAPOR) Transparency Initiative. Many polling firms belong to this transparency initiative, including both Change Research and Marquette Law School Poll. Thus, the emphasis is on clearly following ethical standards.
To determine the level of transparency in a poll, look at the polling house report. See if you can determine the sampled population, the sample size, and some important characteristics of the sample. Cross-tabulations are key indicators of transparency. As an example of such crosstabs, review this poll of 13 June 2024, conducted by Monmouth University, another member of the transparency initiative. Note that this report is broken into three parts. The first is the narrative. This is followed by the questions and results. Finally, there are the methodology and the crosstabs.
Like most things in the world dealing with human beings, polling is not an exact science
If starting with a popular press article, one should always find a link to the original polling house report. Additionally, the author needs to provide some indicator of precision like a margin of error or an interval (confidence or credible). An indication of precision allows the reader to better understand the fact that poll estimates are imprecise and that candidate separations of 2 or 3 points tell us nothing about who is actually in the lead. Note that the usual formulas for confidence intervals only address the variability of the ideal poll, a.k.a. the “error attributable to sampling.” They do not provide bounds on the actual uncertainty due to incorrect weightings, improper questions, lying respondents, and the like. However, some indicator of precision is better than none.
Polls are just approximations of reality
Like most things in the world dealing with human beings, polling is not an exact science. While it is designed to parse life to provide information about the world around us, it is at the mercy of several sources of randomness, including the inescapable randomness of sampling. Even so, political polls do give us information about the mood of the electorate at points in time. This information, however, is neither entirely accurate nor entirely precise. Polls are not reality; they are approximations of it.
The best way to interpret polls is to know how they are performed, because this will give insight into the sources of error, both systematic (bias) and random (variability). Reading through the methodology section of the polling house report is slow at first, but there is a lot of important information included. If there is no methodology section, one should ask why.
Finally, as with all approximations of the world, one should approach polls with humility, lest we return with humiliation. As Yeargain wrote1:
“For better or for worse, election polls drive the vast majority of political journalism and analysis. Polls are frequently taken at face value and reported breathlessly, especially when they show surprising or unexpected results. Though most pollsters adhere to sound methodological practices, the dependence of political journalism – and campaigns, independent political organizations, and so on – on polls opens a door for the unsavory.”
Hopefully, this article helps you avoid the unsavory in the run-up to 5 November.
References
Yeargain, T. (2020). Fake Polls, Real Consequences: The Rise of Fake Polls and the Case for Criminal Liability. Missouri Law Review, 85(1): 129-190.
Ole J. Forsberg is an associate professor of mathematics-statistics and chair of the data sciences program at Knox College in Illinois. He specialises in modeling and testing elections and is the author of the two editions of Understanding Elections using Statistics: Polling, prediction, and testing, published by CRC Press.
You might also like: Democracy in the UK: has female representation improved?


